.png)

In our previous post we built a cost effective, open source monitoring stack as a drop-in alternative to Datadog: Prometheus, Grafana Mimir for scalable metric storage, Loki for logs, Tempo for traces, and OpenTelemetry as the collection backbone. All deployed to Kubernetes via a single Terraform module.
Running that stack in earnest quickly exposes one predictable limit. At scale, storing traces and logs in object storage is economical, but query latency creeps up. Interactive, ad-hoc exploration across millions of spans can take several seconds too many. We also wanted continuous profiling baked in from the start rather than bolted on later. This post covers the two additions that address both: ClickHouse as a high-performance backend for traces and logs, and Grafana Pyroscope for continuous profiling. It also summarises the other improvements that landed in PR #5 of our terraform-k8s-monitoring module.
Why Use ClickHouse for Observability at Scale?
Tempo and Loki's object storage backends are great for cost efficiency at any scale. Where they can struggle is interactive, ad-hoc querying. Scanning wide time ranges across millions of spans or log lines can take a long time. And we find that when trying to find a problem on a large log output (above roughly 10,000 lines), Loki starts to feel sluggish.
ClickHouse is a columnar OLAP database purpose-built for exactly this workload: compressed columnar storage, vectorised execution, and sub-second aggregations over billions of rows. The key insight though is that you don't have to choose between speed and cost. ClickHouse supports a tiered storage model where hot data lands on fast local NVMe for low-latency reads and writes, while older data is transparently moved to S3-compatible object storage, the same cheap tier you're already paying for with Loki and Tempo. You get sub-second query performance where it matters, without giving up the economics you came for.
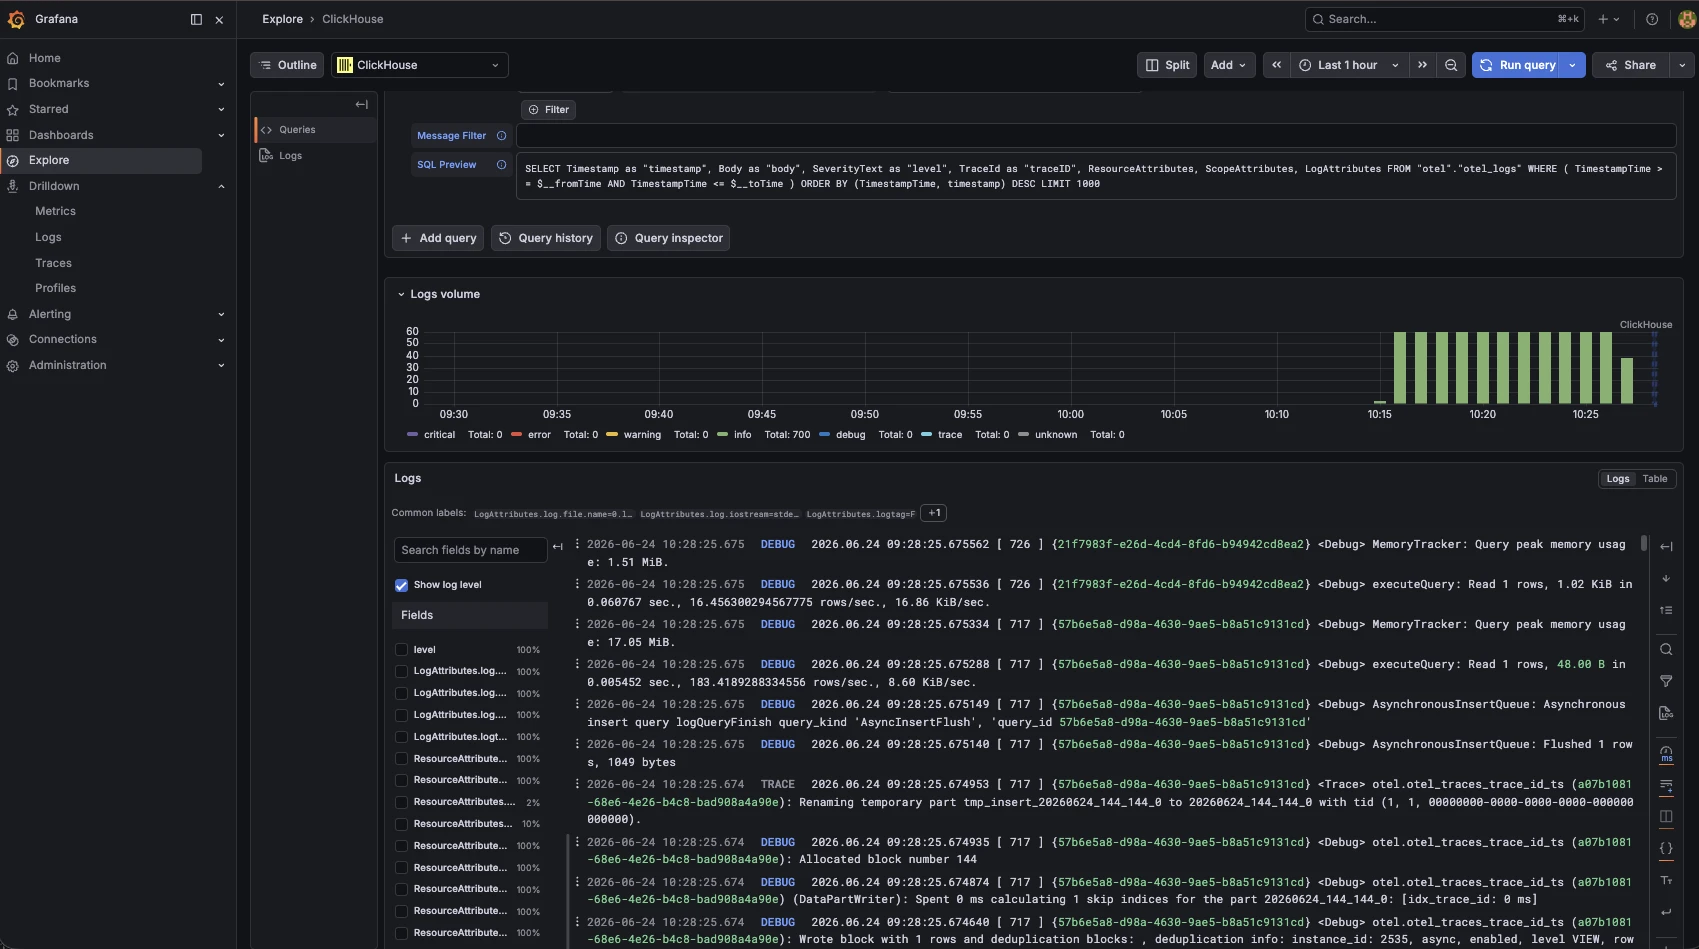
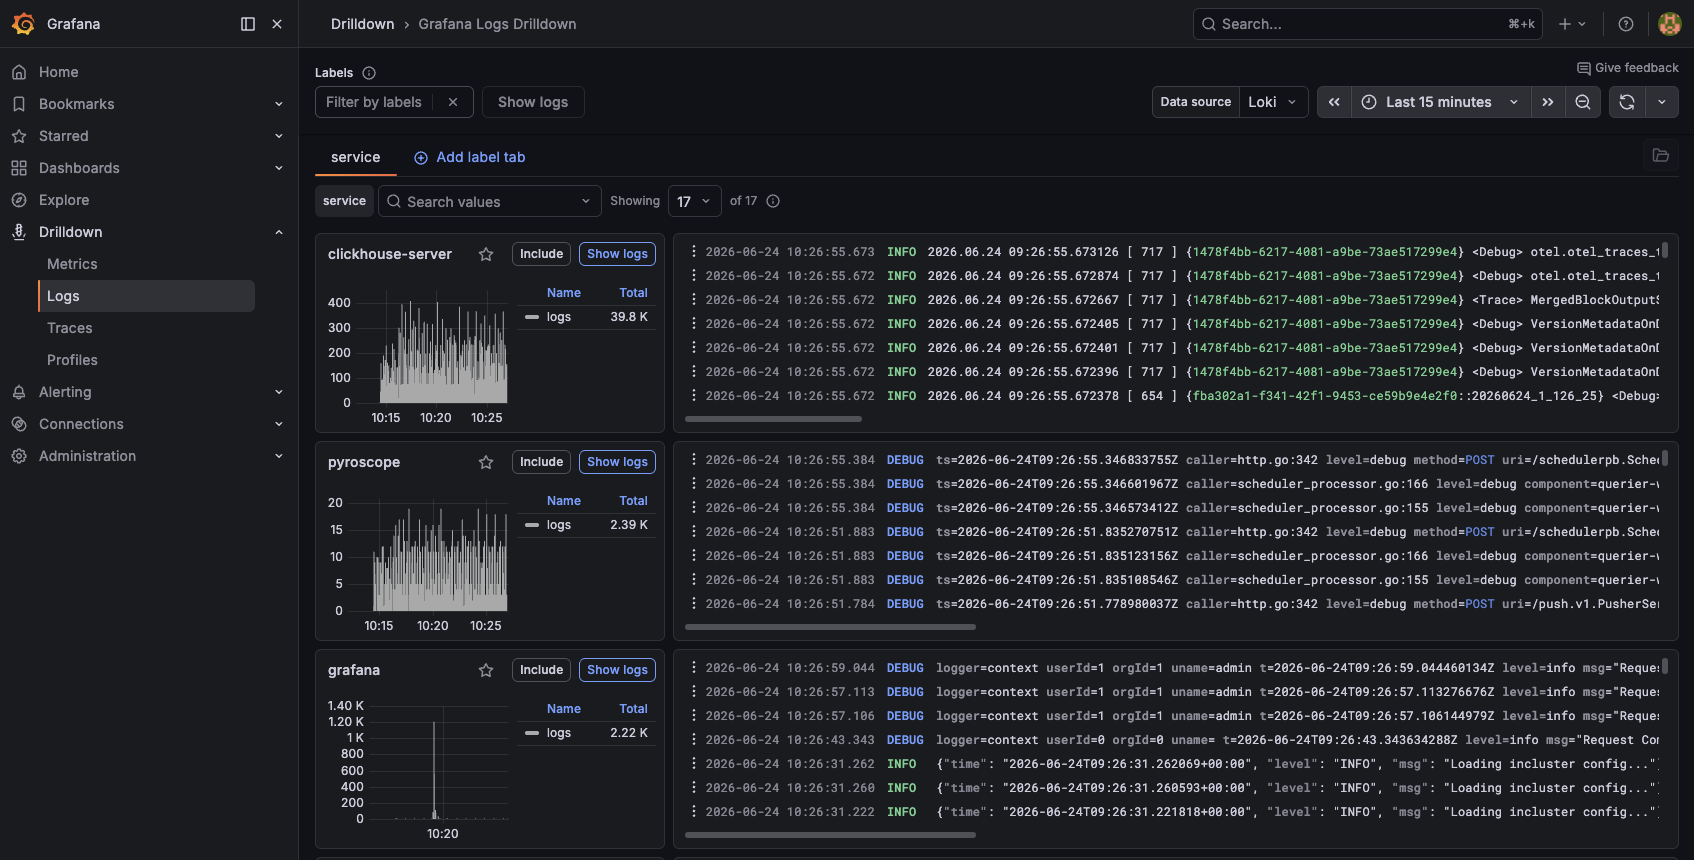
The OpenTelemetry Collector ships a first-class clickhouse exporter. When enabled, the collector creates the OTel schema tables automatically on startup and forwards logs and traces in parallel with or instead of Loki and Tempo. Grafana's ClickHouse datasource plugin then lets you query those tables directly from dashboards or Explore with full SQL and sub-second response times.
For full details on configuring the S3 tiered storage backend, see the ClickHouse S3 integration docs.
Deploying ClickHouse on Kubernetes with the ClickHouse Operator
We use the ClickHouse Operator from ghcr.io/clickhouse, which introduces ClickHouseCluster and KeeperCluster CRDs. A minimal single-shard, single-replica deployment looks like this:
apiVersion: clickhouse.com/v1alpha1
kind: KeeperCluster
metadata:
  name: clickhouse-keeper
  namespace: clickhouse-operator-system
spec:
  replicas: 1
  dataVolumeClaimSpec:
    accessModes: [ReadWriteOnce]
    resources:
      requests:
        storage: 5Gi
---
apiVersion: clickhouse.com/v1alpha1
kind: ClickHouseCluster
metadata:
  name: clickhouse
  namespace: clickhouse-operator-system
spec:
  shards: 1
  replicas: 1
  containerTemplate:
    resources:
      requests: { cpu: "1", memory: "2Gi" }
      limits:   { cpu: "2", memory: "2Gi" }
  keeperClusterRef:
    name: clickhouse-keeper
  dataVolumeClaimSpec:
    accessModes: [ReadWriteOnce]
    resources:
      requests:
        storage: 10Gi
For production, bump shards and replicas and point storage at a distributed block device. The operator handles rolling updates and rebalancing.
I found what it may well be a bug in the Grafana Clickhouse plugin. When the db schema is automatically created the TimestampTime column has the wrong type. I fixed it with:
ALTER TABLE otel.otel_logs DROP COLUMN IF EXISTS TimestampTime;
ALTER TABLE otel.otel_logs ADD COLUMN IF NOT EXISTS TimestampTime DateTime64(9) MATERIALIZED Timestamp;
Wiring ClickHouse into the Terraform Module
The operator itself is a Helm release managed alongside the monitoring modules:
resource "helm_release" "clickhouse_operator" {
  name             = "clickhouse-operator"
  repository       = "oci://ghcr.io/clickhouse"
  chart            = "clickhouse-operator-helm"
  namespace        = "clickhouse-operator-system"
  create_namespace = true
  set {
    name  = "installCRDs"
    value = "true"
  }
}
The OTel Collector module now accepts a clickhouse_endpoint variable. Setting it is all that is needed. The collector config is generated automatically and ClickHouse schema tables are created on first startup:
module "otel" {
  source = "github.com/digitalis-io/terraform-k8s-monitoring//modules/otel-collector"
  otel = {
    tempo_endpoint      = module.tempo.otlp_grpc_endpoint
    mimir_endpoint      = module.mimir.remote_write_endpoint
    loki_endpoint       = module.loki.datasource_url
    clickhouse_endpoint = "tcp://clickhouse-clickhouse-headless.clickhouse-operator-system.svc.cluster.local:9000?database=otel"
  }
}
The ClickHouse exporter variables available in the module:
On the Grafana side, the Prometheus module wires in the ClickHouse datasource plugin automatically:
module "prometheus" {
  source = "github.com/digitalis-io/terraform-k8s-monitoring//modules/prometheus"
  prometheus = {
    # ... other vars
    clickhouse_datasource = {
      host     = "clickhouse-clickhouse-headless.clickhouse-operator-system.svc.cluster.local"
      database = "otel"
    }
  }
}
Grafana provisions the datasource and loads the grafana-clickhouse-datasource plugin on startup, so no manual plugin installation is needed.
Continuous Profiling with Grafana Pyroscope
The fourth pillar of observability is often overlooked: continuous profiling. While traces tell you where time is spent across services, profiling tells you why, right down to the function call. Grafana Pyroscope is the open source continuous profiling backend, and it integrates natively into the Grafana UI alongside your metrics, logs, and traces.
A new pyroscope module is now part of the stack. In its simplest form:
module "pyroscope" {
  source = "github.com/digitalis-io/terraform-k8s-monitoring//modules/pyroscope"
  pyroscope = {
    create_namespace = false
  }
}
The module supports the same storage backends as Mimir and Loki: local disk for development, or S3/GCS/Azure for production:
module "pyroscope" {
  source = "github.com/digitalis-io/terraform-k8s-monitoring//modules/pyroscope"
  pyroscope = {
    storage = {
      backend   = "s3"
      s3_bucket = "my-pyroscope-profiles"
      s3_region = "eu-west-1"
    }
    service_account_annotations = {
      "eks.amazonaws.com/role-arn" = "arn:aws:iam::123456789012:role/pyroscope"
    }
  }
}
Wire Pyroscope into Grafana via the Prometheus module:
prometheus = {
  # ...
  pyroscope_datasource_url = "http://pyroscope-headless:4040"
}
.webp)
Scraping Profiles from Your Applications
Pyroscope uses Pod annotations to discover scrape targets, so no separate ServiceMonitor CRDs are needed. Add these to any Pod you want profiled:
annotations:
  profiles.grafana.com/cpu.scrape: "true"
  profiles.grafana.com/cpu.port: "6060"
  profiles.grafana.com/memory.scrape: "true"
  profiles.grafana.com/memory.port: "6060"
  profiles.grafana.com/goroutine.scrape: "true"
  profiles.grafana.com/goroutine.port: "6060"
For Go applications, combine Pyroscope scraping with the OTel Go eBPF auto-instrumentation below to get traces and profiles without modifying a single line of application code.
.webp)
OTel Operator and Go eBPF Auto-Instrumentation
A new operator block in the OTel module deploys the OpenTelemetry Operator, which introduces OpenTelemetryCollector and Instrumentation CRDs and enables zero-code tracing for Go services via eBPF:
module "otel" {
  source = "github.com/digitalis-io/terraform-k8s-monitoring//modules/otel-collector"
  otel = {
    # ...
    operator = {
      enabled                    = true
      go_instrumentation_enabled = true
    }
  }
}
With the operator running, a single Pod annotation is enough to get auto-instrumented traces:
annotations:
  instrumentation.opentelemetry.io/inject-go: "true"
  instrumentation.opentelemetry.io/otel-go-auto-target-exe: "/src/myservice"
The operator injects an eBPF sidecar that intercepts function calls in the target binary. No SDK changes, no recompile.
Getting Started
The full Terraform module is at github.com/digitalis-io/terraform-k8s-monitoring.
A minimal full-stack deployment in main.tf:
resource "helm_release" "clickhouse_operator" {
  name             = "clickhouse-operator"
  repository       = "oci://ghcr.io/clickhouse"
  chart            = "clickhouse-operator-helm"
  namespace        = "clickhouse-operator-system"
  create_namespace = true
  set { name = "installCRDs"; value = "true" }
}
module "mimir"  { source = "github.com/digitalis-io/terraform-k8s-monitoring//modules/mimir" }
module "loki"   { source = "github.com/digitalis-io/terraform-k8s-monitoring//modules/loki" }
module "tempo" {
  source = "github.com/digitalis-io/terraform-k8s-monitoring//modules/tempo"
  tempo  = { metrics_generator_remote_write_url = module.mimir.remote_write_endpoint }
}
module "pyroscope" {
  source    = "github.com/digitalis-io/terraform-k8s-monitoring//modules/pyroscope"
  pyroscope = { create_namespace = false }
}
module "prometheus" {
  source = "github.com/digitalis-io/terraform-k8s-monitoring//modules/prometheus"
  prometheus = {
    mimir_remote_write_url   = module.mimir.remote_write_endpoint
    mimir_datasource_url     = module.mimir.query_frontend_endpoint
    loki_datasource_url      = module.loki.datasource_url
    tempo_datasource_url     = module.tempo.datasource_url
    pyroscope_datasource_url = "http://pyroscope-headless:4040"
    clickhouse_datasource = {
      host     = "clickhouse-clickhouse-headless.clickhouse-operator-system.svc.cluster.local"
      database = "otel"
    }
  }
}
module "otel" {
  source = "github.com/digitalis-io/terraform-k8s-monitoring//modules/otel-collector"
  otel = {
    tempo_endpoint      = module.tempo.otlp_grpc_endpoint
    mimir_endpoint      = module.mimir.remote_write_endpoint
    loki_endpoint       = module.loki.datasource_url
    clickhouse_endpoint = "tcp://clickhouse-clickhouse-headless.clickhouse-operator-system.svc.cluster.local:9000?database=otel"
    operator            = { enabled = true; go_instrumentation_enabled = true }
  }
  depends_on = [helm_release.clickhouse_operator, module.prometheus]
}
Run terraform init && terraform apply and you have a full observability platform: metrics, logs, traces, profiles, and fast ad-hoc query, all self-hosted, all open source.
Closing Thoughts
The original post made the case for ditching the SaaS bill and taking back control of your observability data. This follow-up is really about making that choice scale.
Loki and Tempo are excellent at what they do, but as your deployment grows you inevitably hit the point where "it's in there somewhere" turns into a slow and frustrating query. Adding ClickHouse as a fast query layer solves that without throwing away the cheap object-storage backend you already have. You get the speed of a columnar database and the economics of S3 at the same time.
Pyroscope fills the last gap. Metrics tell you something is slow. Traces tell you which service. Logs tell you what happened. Profiles tell you why, right down to the function burning the CPU. Having all four signals in Grafana, correlated and queryable from the same UI, is genuinely closer to the Datadog experience than anything we've had in the open-source world before.
The terraform module means you don't have to assemble any of this yourself. One terraform apply and you have the whole stack running on your own infrastructure, under your own terms, with no per-host or per-GB pricing surprises at the end of the month.
If you want to try it out, the code is at github.com/digitalis-io/terraform-k8s-monitoring. And if you'd rather have someone else handle the deployment and ongoing operation, that's what we're here for — get in touch.
I, for one, welcome our new robot overlords.
.png)