.png)
Why monitor certificate expiry
HTTPS encrypts traffic between clients and servers. Without it, credentials, API tokens, and anything else on the wire is exposed to interception or tampering.
Most of the ecosystem now assumes it. Browsers flag plain HTTP as insecure, API clients reject untrusted endpoints, and search engines treat HTTPS as a ranking signal.
At the core of HTTPS is the TLS certificate, typically an X.509 cert signed by a Certificate Authority (CA). Certificates have a fixed validity period and can also be revoked before that. Renewing one in a real organisation usually involves multiple teams and approval steps, with lead times measured in days or weeks rather than minutes.
The critical risk is that expiry is silent. There is no degraded state. The cert is valid until it isn't, and then the service stops working. Browser warnings appear, integrations break, and what should have been a routine renewal turns into an after-hours incident.
Monitoring expiry catches this in advance. The rest of the article builds a small Prometheus and Blackbox Exporter stack that does exactly that.
What you will learn from this walkthrough
- Monitor HTTPS certificate expiry
- Expose TLS and probe metrics with Blackbox Exporter
- Configure Prometheus to scrape and evaluate them
- Alert on expiry through Alertmanager
- Run the whole stack locally with Docker Compose
What we are going to build
Four containers wired together:
- An NGINX server on
localhost:8443serving HTTPS, with a cert signed by a local CA we generate ourselves. Using a private CA means we control validity dates and can trigger expiry on demand without waiting on a real renewal. - Prometheus Blackbox Exporter (referred to as Blackbox Exporter from here on) probing the endpoint, doing a full TLS handshake against the local CA and exposing probe and certificate metrics.
- Prometheus scraping those metrics on an interval. The one that matters here is the certificate expiry timestamp.
- Prometheus Alertmanager (Alertmanager from here on) receiving firing alerts from Prometheus and, in a real deployment, routing them somewhere actionable.
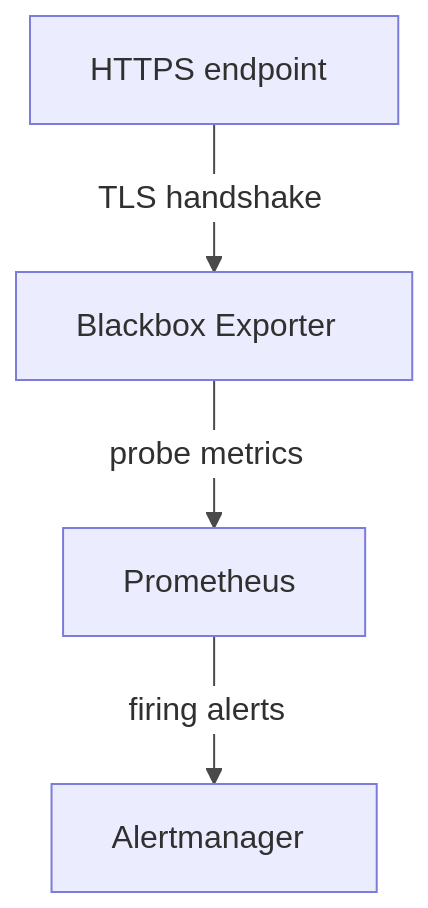
In practical terms, the flow works as follows:
- The HTTPS endpoint exposes the certificate
- Blackbox Exporter performs the TLS handshake and extracts certificate details
- Prometheus stores and evaluates the resulting metrics
- Alertmanager notifies us before the certificate expires
This architecture provides a simple but production-relevant example of how certificate monitoring can be automated to reduce operational risk and prevent avoidable outages.
Implementation walkthrough
The full project is available at github.com/digitalis-io/blog-https-prom-cert-blackbox-exporter. Clone it and bring the stack up from the repo root:
docker compose up -d
Step 1 — Create the target HTTPS service
The first component we need is a simple HTTPS endpoint that will act as the monitoring target: NGINX serving a static page over HTTPS. The service in docker-compose.yml:
services:
  web:
    image: nginx:1.30
    restart: unless-stopped
    volumes:
      - ./nginx.conf:/etc/nginx/nginx.conf:ro
      - ./certs:/etc/nginx/certs:ro
      - ./index.html:/usr/share/nginx/html/index.html:ro
    ports:
      - "8443:8443"
The mounts give it the NGINX config, the generated TLS material, and a one-line HTML page. Port 8443 avoids privileged-port binding while still signalling HTTPS to the reader.
Configure NGINX for HTTPS
nginx.conf is deliberately minimal:
events {}

http {
    server {
        listen 8443 ssl;
        server_name web localhost;

        ssl_certificate     /etc/nginx/certs/server.crt;
        ssl_certificate_key /etc/nginx/certs/server.key;

        ssl_protocols TLSv1.2 TLSv1.3;
        ssl_prefer_server_ciphers on;

        location / {
            root /usr/share/nginx/html;
            index index.html;
        }
    }
}
server_name covers both web (service-to-service traffic on the Compose network) and localhost (testing from the host). Only TLS 1.2 and 1.3 are accepted.
Add a simple test page
The "application" is one line:
<!DOCTYPE html>
<html><body><h1>Hello, HTTPS!</h1></body></html>
We just need something for TLS to terminate against.
Validate the HTTPS endpoint
Sanity-check that TLS works before bolting monitoring on top.
curl -v --cacert certs/ca.crt https://localhost:8443
Or look at the certificate directly:
openssl s_client -connect localhost:8443 -CAfile certs/ca.crt
Both confirm the server is reachable, the handshake succeeds, and the chain validates against the local CA.
Step 2 — Add Blackbox Exporter
Blackbox Exporter acts as an external client: it opens a connection to a target, completes the TLS handshake, and exposes the result as Prometheus metrics. That handshake is exactly what we need to read the certificate.
Define the Blackbox Exporter service
Add to docker-compose.yml:
  blackbox-exporter:
    image: prom/blackbox-exporter:v0.28.0
    restart: unless-stopped
    depends_on:
      - web
    command: ['--config.file=/etc/blackbox_exporter/blackbox.yml']
    volumes:
      - ./blackbox.yml:/etc/blackbox_exporter/blackbox.yml:ro
      - ./certs:/etc/blackbox_exporter/certs:ro
    ports:
      - "9115:9115"
depends_on makes Compose bring web up first so the exporter has something to probe at boot. We use the same pattern across the rest of the stack to keep startup ordered. The exporter listens on 9115 for Prometheus to scrape. The mounts give it the probe config and the local CA so it can validate our cert chain.
Configure the Blackbox probe
blackbox.yml defines how the probe behaves:
modules:
  https_2xx:
    prober: http
    timeout: 5s
    http:
      method: GET
      fail_if_not_ssl: true
      preferred_ip_protocol: ip4
      tls_config:
        ca_file: /etc/blackbox_exporter/certs/ca.crt
This defines a module called https_2xx: an HTTP probe with TLS validation enabled.
The parameters:
prober: httpuses the HTTP prober. TLS is negotiated automatically when the target URL is https://.fail_if_not_ssl: truefails the probe if the target is plain HTTP. Stops a misconfigured target from silently passing on the TLS side.preferred_ip_protocol: ip4pins to IPv4. Avoids ambiguity in environments where IPv6 is half-configured.tls_config.ca_fileis the CA the exporter trusts when validating the server cert.
The ca_file line is the one that actually matters here. Our cert is signed by a private CA, so the exporter has to be told about it explicitly. Without it the handshake fails and no certificate metrics get emitted. In production with a public CA (Let's Encrypt, DigiCert, etc.) you can drop tls_config entirely and rely on the system trust store.
Validate the probe
Hit the exporter directly:
http://localhost:9115/probe?target=https://web:8443&module=https_2xx
The output should include probe_success, probe_http_ssl, and probe_ssl_earliest_cert_expiry. The last one is the certificate expiry as a Unix timestamp and is what we will alert on.
Step 3 — Configure Prometheus
Prometheus scrapes the exporter on an interval and evaluates the results.
Define the Prometheus service
In docker-compose.yml:
  prometheus:
    image: quay.io/prometheus/prometheus:v3.11.2
    restart: unless-stopped
    depends_on:
      - blackbox-exporter
      - alertmanager
    ports:
      - "9090:9090"
    command:
      - '--config.file=/etc/prometheus/prometheus.yml'
      - '--storage.tsdb.path=/prometheus'
    volumes:
      - ./prometheus.yml:/etc/prometheus/prometheus.yml:ro
      - ./alert-rules.yml:/etc/prometheus/alert-rules.yml:ro
      - prometheus:/prometheus

volumes:
  prometheus: {}
Prometheus listens on 9090. The mounts give it the scrape config (prometheus.yml), the rules file (alert-rules.yml), and a named volume for the TSDB so data survives container restarts.
Configure scraping via Blackbox Exporter
prometheus.yml:
global:
  scrape_interval: 15s
  evaluation_interval: 15s

scrape_configs:
  - job_name: blackbox-https
    metrics_path: /probe
    params:
      module: [https_2xx]

    static_configs:
      - targets:
          - https://web:8443

    relabel_configs:
      - source_labels: [__address__]
        target_label: __param_target

      - source_labels: [__param_target]
        target_label: instance

      - target_label: __address__
        replacement: blackbox-exporter:9115
global sets how often Prometheus scrapes (scrape_interval) and how often it evaluates rules (evaluation_interval).
The scrape_configs block defines a job blackbox-https that uses the https_2xx module to probe our HTTPS endpoint. The unusual bit is that Prometheus isn't talking to the target directly. The flow is:
Prometheus -> Blackbox Exporter -> HTTPS endpoint
Prometheus scrapes the exporter, and the exporter probes the target.
How relabeling works
The end-result URL Prometheus needs to hit is:
http://blackbox-exporter:9115/probe?target=https://web:8443&module=https_2xx
The three relabel steps build that.
Step 1 — Pass the target as a parameter
- source_labels: [__address__]
  target_label: __param_target
The target https://web:8443 gets copied into a __param_target label. Labels prefixed with __param_ become URL query parameters, so this produces:
?target=https://web:8443
Step 2 — Preserve the instance label
- source_labels: [__param_target]
  target_label: instance
Without this, every metric would carry instance="blackbox-exporter:9115" and you couldn't tell endpoints apart.
Step 3 — Redirect the scrape to the exporter
- target_label: __address__
  replacement: blackbox-exporter:9115
The scrape address is rewritten to point at the exporter. From here on, Prometheus connects to the exporter and not directly to the HTTPS endpoint.
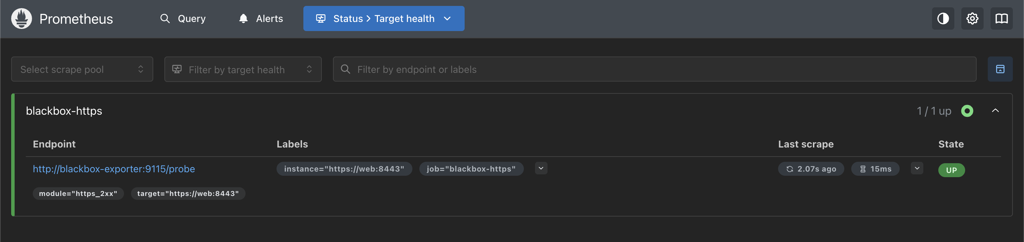
Validate Prometheus
You can access the UI at http://localhost:9090. The Targets page should show the blackbox-https job UP.
Step 4 — Configure alerting with Alertmanager
Prometheus evaluates the alert rules. Alertmanager receives firing alerts and, in real deployments, routes them somewhere actionable.
Define the Alertmanager service
  alertmanager:
    image: quay.io/prometheus/alertmanager:v0.32.0
    restart: unless-stopped
    ports:
      - "9093:9093"
Alertmanager listens on 9093.
Configure Prometheus alerting
Add to prometheus.yml:
rule_files:
  - /etc/prometheus/alert-rules.yml

alerting:
  alertmanagers:
    - static_configs:
        - targets:
            - alertmanager:9093
rule_files tells Prometheus where to load alert and recording rules from. alerting points it at the Alertmanager instance to forward firing alerts to. Prometheus handles evaluation, Alertmanager handles delivery.
Define the alert rule
alert-rules.yml:
groups:
  - name: certificate-alerts
    rules:
      - alert: SSLCertificateExpiringSoon
        expr: probe_ssl_earliest_cert_expiry > 0 and (probe_ssl_earliest_cert_expiry - time()) / 86400 < 30
        for: 1m
        labels:
          severity: warning
        annotations:
          summary: "SSL certificate expiring soon"
          description: "Certificate for {{ $labels.instance }} expires in less than 30 days."

      - alert: BlackboxProbeFailed
        expr: probe_success == 0
        for: 5m
        labels:
          severity: critical
        annotations:
          summary: "Blackbox probe failing for {{ $labels.instance }}"
          description: "Probe has been failing for 5+ minutes. The endpoint is unreachable or its TLS handshake is broken (expired certificate, hostname mismatch, untrusted CA, ...)."
SSLCertificateExpiringSoon is the heart of this article. It uses probe_ssl_earliest_cert_expiry, the certificate expiry as a Unix timestamp. The expression:
(probe_ssl_earliest_cert_expiry - time()) / 86400
gives days remaining. time() is the current Unix timestamp, subtracting gives remaining lifetime in seconds, dividing by 86400 converts to days. The alert fires when that drops below 30. for: 1m makes sure the condition holds across at least one full evaluation window before firing.
BlackboxProbeFailed is a small but important safety net. Blackbox Exporter only emits probe_ssl_earliest_cert_expiry when the TLS handshake actually completes. If the certificate has already expired (or the hostname doesn't match, or the CA is no longer trusted), the expiry alert above goes silent exactly when you most need it. Alerting on probe_success == 0 catches that case so a broken endpoint never goes unnoticed.
Validate alerting
Two UIs:
- Alertmanager: http://localhost:9093
- Prometheus Alerts: http://localhost:9090/alerts
If the cert is below the threshold, the alert will show as firing. To force that quickly, regenerate certs with 1 or 2 days of validity (see Simulate certificate expiration below).
Notes on the approach
Blackbox Exporter doesn't read certificate files from disk. It opens a real connection, does the full TLS handshake, and pulls cert metadata out of that exchange. Hostname matching, trust chains, and validity all get evaluated the same way a real client would see them. If something is wrong end-to-end, the probe sees it.
Prometheus stores the resulting expiry timestamp and compares it against time() on each evaluation. Alertmanager handles delivery, so routing and grouping can change without touching the rules. Standard probe / evaluate / notify split.
Validate the end-to-end setup
A quick walk through the running stack.
Check Prometheus targets
http://localhost:9090/targets. The blackbox-https job should be UP.
Query probe metrics
In the Prometheus UI (/graph), run:
probe_success
Should return 1.
(probe_ssl_earliest_cert_expiry - time()) / 86400
Returns the number of days remaining on the cert.
Check alert status
http://localhost:9090/alerts. If the cert is above the threshold the alert is inactive.
Verify Alertmanager
http://localhost:9093 should be reachable and show an empty alerts list until something fires.
(Optional) Simulate certificate expiration
Regenerate with one day of validity:
./generate-certs.sh 1
Restart the stack so NGINX picks up the new cert:
docker compose restart
Within one or two evaluation cycles the alert flips to firing in Prometheus and lands in Alertmanager.
Troubleshooting
Common ways this stack breaks.
Probe fails (probe_success = 0)
Symptoms
- probe_success returns 0
- No TLS metrics (e.g. probe_ssl_earliest_cert_expiry)
- Prometheus target may still show UP
Cause
Usually a missing scheme on the probe target:
target=web:8443
instead of:
target=https://web:8443
Solution
Make sure the target is fully qualified: https://web:8443.
No certificate metrics returned
Symptoms
- probe_success is 0 or 1, but no probe_ssl_* metrics
- probe_http_ssl = 0
Cause
The handshake isn't happening, either because the target isn't HTTPS or the connection never completes.
Solution
- Check fail_if_not_ssl: true is set in blackbox.yml
- Make sure the target starts with https://
- Confirm the endpoint is actually serving TLS (openssl s_client is the fastest check)
TLS verification fails (self-signed certificate)
Symptoms
- probe_success = 0
- Certificate validation errors in the exporter logs
- TLS handshake fails in logs
Cause
Blackbox Exporter doesn't trust the private CA.
Solution
Make sure blackbox.yml references the CA:
tls_config:
  ca_file: /etc/blackbox_exporter/certs/ca.crt
And that the directory is mounted in docker-compose.yml:
- ./certs:/etc/blackbox_exporter/certs:ro
Don't reach for insecure_skip_verify outside deliberate failure testing. It papers over the exact problems you're trying to monitor for.
Target works locally but fails in Blackbox
Symptoms
- curl https://localhost:8443 works on the host
- Blackbox probe fails
Cause
Inside the exporter container, localhost is the container itself, not the host or any other service.
Solution
Use the Compose service name:
https://web:8443
Compose handles internal DNS resolution.
Prometheus target shows DOWN
Symptoms
- Target DOWN in http://localhost:9090/targets
Cause
Prometheus can't reach the exporter. Usually:
- wrong service name (blackbox vs blackbox-exporter)
- wrong port
- exporter container isn't running
Solution
Check the scrape address is blackbox-exporter:9115 and the container is up:
docker compose ps
Also check for port or network conflicts.
All targets look identical in Prometheus
Symptoms
- instance is blackbox-exporter:9115 for every metric
- Can't tell endpoints apart
Cause
The relabel step that copies the original target into instance is missing:
- source_labels: [__param_target]
  target_label: instance
Solution
Add it back. Without it every metric looks like it came from the exporter itself.
Alert does not fire
Symptoms
- Metrics show the certificate is close to expiry
- No alert in Prometheus or Alertmanager
Cause
Cert is still above the threshold; rule file isn't loaded; evaluation hasn't run yet; Alertmanager target isn't reachable.
Solution
Check the rules are loaded under http://localhost:9090/rules. Run the expression directly:
(probe_ssl_earliest_cert_expiry - time()) / 86400
Confirm the threshold is what you expect (e.g. < 30) and that the Alertmanager endpoint is reachable from the Prometheus container.
Browser shows "certificate not trusted"
Symptoms
- Browser warning when visiting https://localhost:8443
Cause
The cert is signed by a private CA the browser doesn't trust.
Solution
Expected in a lab. Either click through, or import ca.crt into your system trust store.
Production considerations
The setup here optimises for being reproducible on a laptop. A few things worth thinking about for real environments.
Use a proper trust model
Real certificates come from a trusted CA. Public services usually use a public CA (Let's Encrypt, DigiCert). Internal services either use a private CA via an internal PKI, or run everything through a public CA. Either way, the monitoring stack has to trust the issuer.
Don't disable TLS verification. insecure_skip_verify removes the ability to detect the very problems you're trying to monitor for.
Tune probes and alert thresholds
Defaults rarely survive contact with real traffic. Worth revisiting:
- probe timeouts, against actual network conditions
- scrape interval, against how fast you need detection
- alert thresholds (30 days vs 7 days vs both), against alert fatigue
Bad tuning either gives you too much noise or detection that lands the day before expiry.
Ensure external visibility
Internal-only probes miss problems users actually hit. For anything public-facing, probe from outside the network too to validate accessibility, DNS, and certificate validity from a real client position.
Validate the full certificate chain
Expiry isn't the only failure mode. Watch for missing intermediates, broken bundles, and hostname mismatches. Because Blackbox Exporter does a full handshake, all of these surface as probe failures when tls_config is set up properly.
Ensure monitoring system availability
The monitoring stack is itself critical infrastructure. Plan high availability for Prometheus, Blackbox Exporter, and Alertmanager. Otherwise the thing that's meant to warn you about cert problems can go down without anyone noticing.
Integrate alerting with real workflows
Alerts have to land somewhere a human will read them: email, Slack, Teams, PagerDuty, whatever your on-call uses. Alertmanager's job is to route them. Configure receivers and routing trees properly or the alert is effectively silent.
Wrapping up
Going through the components one at a time is the point. When something breaks (and at some point it will), you want to know which part to look at first. Copy-pasting the configs without that context is how monitoring stacks end up running for years before anyone realises they've stopped working.
If you'd like support implementing or scaling this kind of setup, the team at Digitalis.io has extensive experience in observability, monitoring, and production operations. We support organisations across the full lifecycle, from initial design and implementation to fully managed services that keep systems reliable, secure, and operating over time.