Preamble (or pre-ramble)
After writing this blog post, I found that it could feel a bit overwhelming as it introduces many different technologies. I wanted to write a foreword of reassurance: it is not as bad as it looks. Yes, there are a lot of components, but in all honesty, they’re pretty straightforward.
Once you have installed and set up the server side, the client part can be as simple as a single application. My preferred option here is Grafana Alloy. Think of it as a one-to-one replacement for the DataDog agent. I hope you enjoy the blog post.
What is Datadog, Anyway?
If you're in the tech world, chances are you've heard of them. They're a popular, comprehensive observability service that many companies use to keep tabs on their cloud-scale applications. Think of it as a central nervous system for your IT infrastructure.
So, what can Datadog actually do? Well, quite a lot! It's designed to give you real-time visibility into just about everything that makes your applications tick. This includes:
- Infrastructure Monitoring: Keeping an eye on your servers, virtual machines, containers, and cloud services to ensure they're healthy and performing optimally.
- Application Performance Monitoring (APM): Diving deep into your code to track requests, identify bottlenecks, and optimise your application's speed and responsiveness.
- Log Management: Collecting, centralising, and analysing all your application and system logs for troubleshooting, security, and auditing.
- Network Performance Monitoring: Understanding how your network is performing and identifying any issues that could impact your applications.
- Security Monitoring: Detecting potential threats and vulnerabilities across your environment.
- Synthetic Monitoring: Proactively testing your applications and APIs from various locations to ensure they're always available and performing well for your users.
- Real User Monitoring (RUM): Understanding the actual experience of your users by tracking their interactions with your applications.
In essence, Datadog brings together all these different data points – metrics, logs, and traces – into a single platform with customizable dashboards, powerful alerting, and integration with hundreds of technologies. It's a fantastic tool for getting a holistic view of your systems and quickly pinpointing issues.

You can read more about why we need to collect logs in this previous blog post
https://digitalis.io/post/collecting-metrics-traces-and-logs
Sending metrics, logs and traces
Datadog's approach to collecting data from your infrastructure, whether it's virtual machines (VMs) or containers, primarily revolves around a lightweight, open-source software called the Datadog Agent. This agent is the workhorse that lives on your hosts and is responsible for gathering all the necessary telemetry and shipping it off to the Datadog cloud.
For traditional VMs running operating systems like Linux, Windows, or macOS, you'd install the Agent directly onto the VM itself, just like any other application. Datadog provides platform-specific installation scripts and packages.
In a Kubernetes cluster, the Agent is commonly deployed as a DaemonSet. A DaemonSet ensures that a copy of the Datadog Agent runs on every node in your cluster. This allows it to collect host-level metrics, container metrics, and logs from all pods running on that node.
A Different Approach
Datadog is a Software-as-a-Service (SaaS) offering, which means you pay them to host and manage all this monitoring goodness for you. And for many, that's perfectly fine! But what if you crave a little more control? What if you want to own your data outright, run things within your own infrastructure, and potentially reduce recurring costs in the long run? That's where building your own on-premises monitoring solution comes in.
This isn't about shunning Datadog because it's "bad." It's about exploring an alternative that prioritises:
- Data Ownership: With an on-premises setup, your data stays within your own infrastructure, giving you full control over its security, privacy, and compliance. This is a big deal for organisations with strict regulatory requirements or those who simply prefer to keep their sensitive data close. You're not relying on a third-party provider's data retention policies or security practices.
- Running On-Premises: For some, having their monitoring infrastructure located physically within their own data centres or private cloud environments is a non-negotiable. This could be due to specific security policies, latency concerns, or even just a preference for managing their own hardware. It gives you direct oversight and the ability to customise everything to your exact needs.
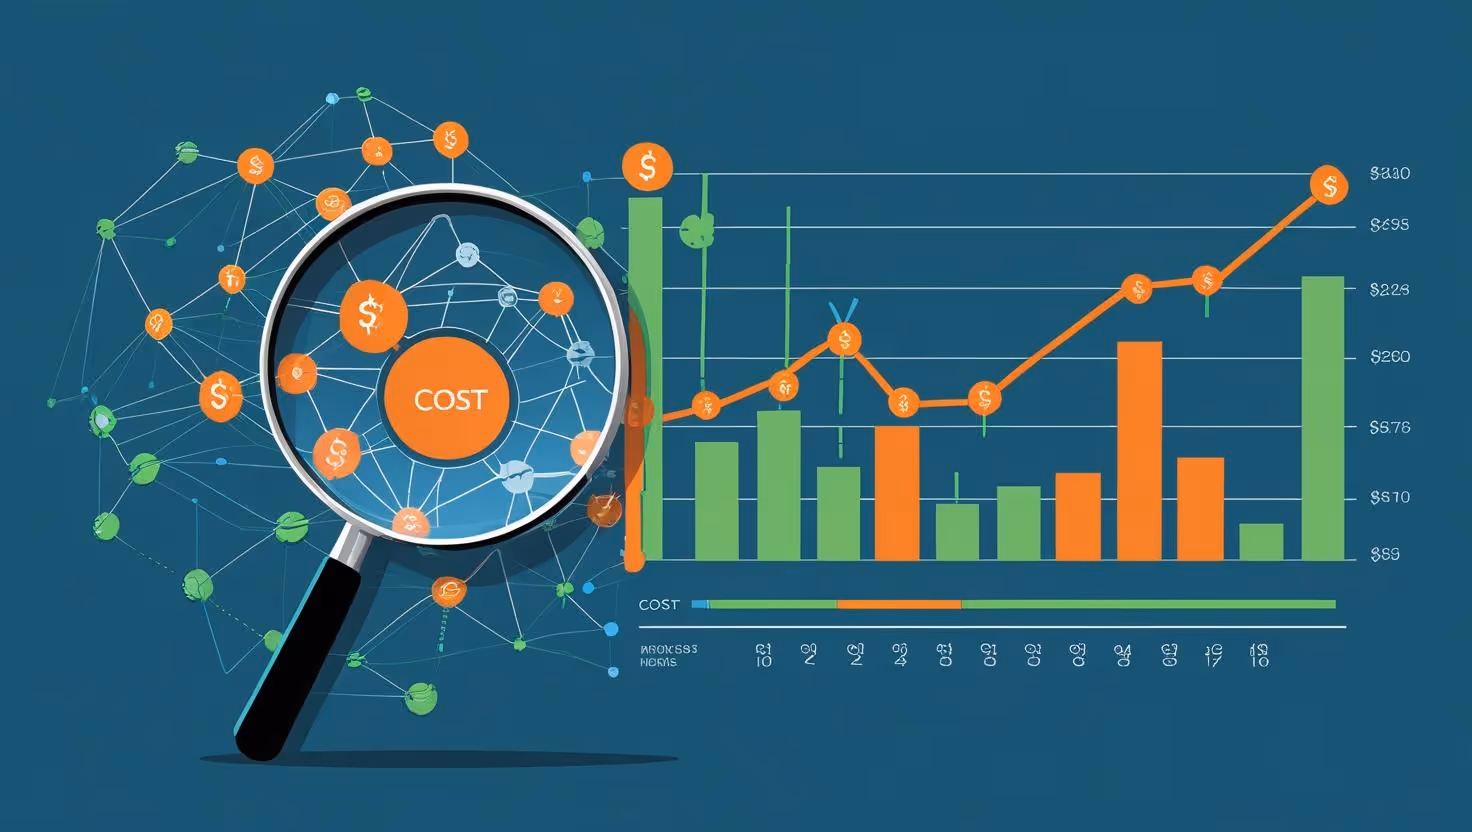
- Lower Costs (Potentially): While there's an initial investment in setting up and maintaining an on-premises solution, you can often see significant cost savings in the long term compared to the recurring, usage-based fees of a SaaS platform. Datadog's pricing, for instance, can scale quite rapidly with the volume of data you ingest, the number of hosts you monitor, and the features you use. By owning your infrastructure, you can better predict and control your expenses, especially as your monitoring needs grow.
In the upcoming sections, we'll dive into how we can leverage the power of Prometheus, Grafana Mimir, Loki and OpenTelemetry to build a robust, flexible, and cost-effective monitoring stack that can give Datadog a run for its money, all on your terms. Stay tuned!
Prometheus: The Time-Series Champion
Prometheus is an open-source monitoring and alerting toolkit that has become the de facto standard in cloud-native environments, particularly with Kubernetes. It's built around a time-series database (TSDB), which means it stores data as streams of timestamped values. Think of it like a meticulous historian, recording every change in your system over time.
Prometheus primarily uses a pull-based model for collecting metrics. Instead of your applications pushing data to Prometheus, Prometheus "scrapes" (periodically fetches) metrics from instrumented targets (like your applications, servers, or other services) via HTTP endpoints. This pull model simplifies setup and makes it easy to understand what Prometheus is monitoring. It also has a powerful query language called PromQL for flexible data analysis and alerting.
It is worth mentioning that Prometheus can also receive metrics (push) instead if desired and this is more common now since the launch of Grafana Alloy.
Grafana Mimir: Scaling Prometheus to the Stars
While a single Prometheus instance is incredibly powerful, it was designed with local storage in mind. This means its data resides on the same machine where Prometheus is running. This works great for smaller deployments, but for large-scale, highly available, and multi-tenant environments, a single Prometheus can hit its limits. That's where Grafana Mimir comes in.
Grafana Mimir is an open-source, horizontally scalable, highly available, multi-tenant, long-term storage solution specifically designed for Prometheus and OpenTelemetry metrics. It's essentially a distributed system that extends Prometheus's capabilities by providing a robust backend for your metrics data.
1. It Grows With You (Scalability)
Mimir really shines when it comes to scalability. Traditional systems can slow down when they get too much data, but Mimir solves this by splitting the work into smaller parts, like data collectors and searchers, that can run on many machines at once. This approach means you can handle more data simply by adding more machines, so there’s no need to replace everything as your needs grow.
2. It Stays Online (High Availability)
Reliability is another key aspect: traditional systems can leave you vulnerable to losing data or missing alerts if one part fails. Mimir prevents this by making copies of incoming data and saving them in super-reliable storage systems like AWS S3 or MinIO. Plus, because the different parts of the system are kept separate, even if one fails, the rest can keep working without disruption.
3. It Works for Many Teams (Multi-Tenancy)
Finally, multi-tenancy is built in for companies with many teams who all need their own monitoring. Mimir keeps each team’s data separate and secure, even if they share the same system, and it also ensures that no one team can use up all the resources and slow down the others.
Grafana Loki: Like Prometheus, but for Logs
Grafana Loki is an open-source, horizontally scalable, highly available, multi-tenant log aggregation system. Like Mimir, Loki is designed for horizontal scalability. Its components (distributors, ingesters, queriers) can be scaled independently, and using object storage means you don't have to worry about local disk limitations for your log archives.
OpenTelemetry, Grafana Tempo and Jaeger
OpenTelemetry (OTel) is a vendor-neutral, open-source observability framework that provides a unified set of APIs, SDKs, and tools for instrumenting your applications and infrastructure to generate, collect, and export telemetry data.
A trace in OpenTelemetry is a complete journey of a request or transaction as it moves through different parts of a system. Traces are incredibly valuable for developers diagnosing issues because they provide end-to-end visibility into how a request flows through a system. Traces highlight where errors occur and what led up to them—making it easier to reproduce and fix bugs.
To be able to display and store the traces collected by OTel you need a tracing backend. The two most popular are Jaeger and Grafana Tempo.
Grafana: Your Unified Observability Dashboard
Grafana acts as the "single pane of glass" where you connect to various data sources and then build dashboards and use the Explore feature to visualise and query your data. Here's how it works with Loki, Tempo (or Jaeger), and Prometheus:
Displaying Metrics from Prometheus (and Mimir)
Prometheus, or Grafana Mimir as its scalable backend, stores your numerical time-series data. Grafana connects to your Prometheus (or Mimir) instance as a data source.
Dashboards: You can create highly customisable dashboards in Grafana with various panel types (graphs, single stats, gauges, heatmaps, etc.) to visualise your metrics. You use PromQL queries within these panels to select, filter, and aggregate the metric data you want to display. For example, you might have panels showing CPU usage, memory consumption, request rates, error counts, or custom application-specific metrics.
Displaying Logs from Loki
Grafana Loki is designed to be deeply integrated with Grafana. Once configured as a data source, Grafana becomes your primary interface for interacting with your logs.
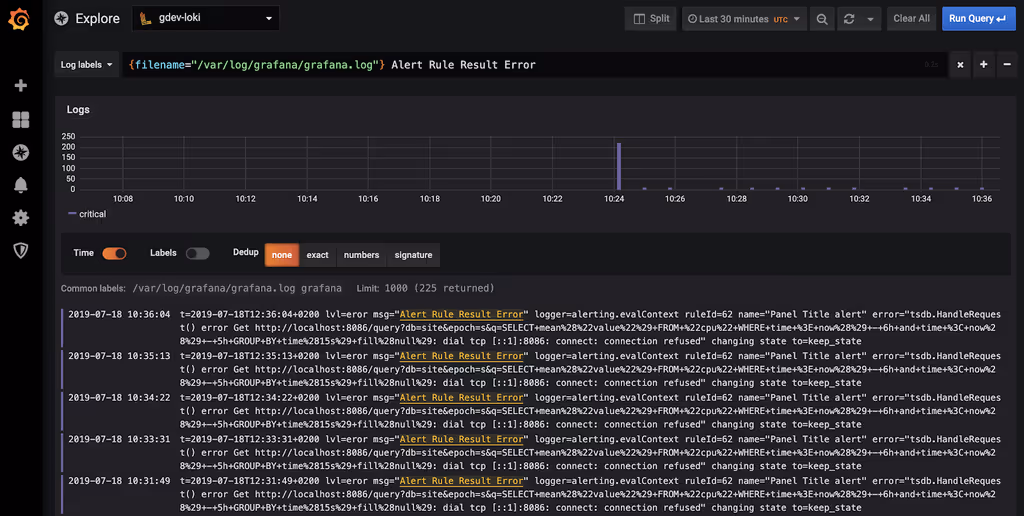
- Explore: The Grafana Explore view is the most common way to work with Loki logs. You select your Loki data source and write LogQL queries. LogQL allows you to filter logs based on labels (e.g., {app="my-service", level="error"}) and then further filter the log content (e.g., |= "failed to connect").
- Live Tail: Loki in Grafana supports a "Live Tail" feature, allowing you to see new log lines stream in real-time, which is excellent for active debugging.
- Logs Panel in Dashboards: You can embed Loki log panels directly into your Grafana dashboards, allowing you to view relevant logs alongside your metrics and traces in a single view.
- Context and Derived Fields: Grafana provides features like "show context" to view log lines before and after a specific event. Derived fields are particularly powerful: you can extract a value from a log line (like a traceID or a userID) and turn it into a clickable link that automatically jumps to a related trace in Tempo/Jaeger or another query in Prometheus.
Displaying Traces from Grafana Tempo (or Jaeger)
For distributed traces, Grafana acts as the visualisation layer for both Grafana Tempo and Jaeger.
- Data Source Configuration: You configure Grafana to connect to either your Grafana Tempo or Jaeger backend as a tracing data source.
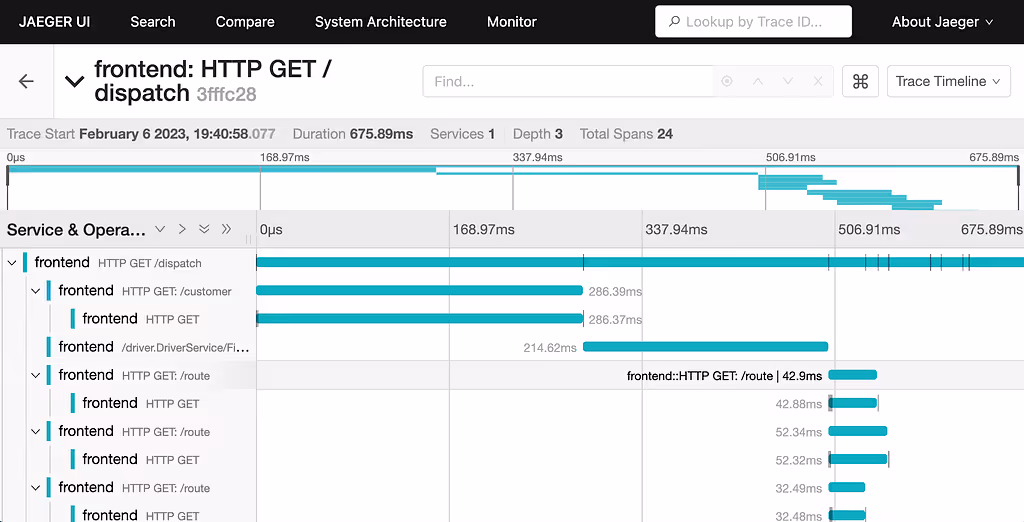
- Explore: In the Explore view, you can query for traces. For Tempo, you'll often start by providing a trace ID (which you might obtain from a correlated log message in Loki or an exemplar from Prometheus). For Jaeger, you can often search by service name, operation name, or tags.
- Trace Visualisation: Once a trace is retrieved, Grafana renders it as a Gantt chart or waterfall diagram, showing the individual spans (operations) within the trace, their durations, relationships, and any associated tags or logs. This visual representation helps you quickly identify bottlenecks or errors across multiple services.
- Service Graphs: Grafana can generate service graphs from your trace data, visually mapping the dependencies between your services and showing aggregated RED (Rate, Errors, Duration) metrics for each service and inter-service call. This gives you a high-level overview of your architecture's health.
- Correlation: This is where the magic truly happens. Grafana facilitates correlation between the three pillars of observability:
- Metrics to Traces: As mentioned with exemplars, you can jump from a metric anomaly to the specific traces that occurred at that time.
- Logs to Traces: Using derived fields in Loki, you can extract a trace ID from a log line and click to view the full trace in Tempo or Jaeger.
- Traces to Logs/Metrics: From a span within a trace, you can often click to see the associated logs from Loki or metrics from Prometheus for that specific service and time.
Final words
Bringing it all together, while commercial services like Datadog offer powerful, turn-key observability, they often come with a trade-off: recurring costs that scale with your data, and less control over where your critical operational data resides.
For those who prioritise data ownership, the ability to run everything on-premises, and significant cost reduction in the long term, a robust open-source stack is a compelling alternative.
Here's the powerful trio we've explored:
- Prometheus (with Grafana Mimir for scalable, long-term storage) handles your metrics. It pulls numerical time-series data from your systems, and Mimir's architecture, leveraging cheap object storage, provides horizontal scalability and high availability, ensuring your historical metrics are always accessible.
- Grafana Loki takes care of your logs. Its unique approach of indexing only log metadata (labels) and storing raw logs in object storage makes it incredibly cost-effective and operationally simple for managing vast quantities of log data.
- OpenTelemetry is the universal instrumentation standard that sits at the foundation. It allows your applications to generate metrics, logs, and traces in a vendor-neutral format, preventing lock-in and giving developers the freedom to choose their observability backends without re-instrumenting code.
- Grafana Tempo acts as the highly scalable and cost-efficient backend for your traces (generated by OpenTelemetry), again leveraging object storage for durable and economical storage of high-volume trace data.
- Finally, Grafana serves as the unified visualisation layer, bringing all your metrics, logs, and traces from Prometheus/Mimir, Loki, and Tempo/Jaeger into intuitive dashboards and an interactive exploration experience. This allows you to correlate different types of telemetry for faster debugging and deeper insights, all from a single pane of glass.
By combining these powerful, community-driven open-source tools, you can build a comprehensive, Datadog-like observability solution that lives within your infrastructure, respects your data privacy needs, and offers predictable, lower costs by utilising readily available and economical object storage. It's about empowering you with control, flexibility, and a truly owned observability future.
If you would like to see a lab of what Digitalis can create for you, come over here
https://github.com/digitalis-io/opentelemtry-local#
Contact our team for a free consultation to discuss how we can tailor our approach to your specific needs and challenges.
I, for one, welcome our new robot overlords
.png)