Do you want to know securely deploy k3s kubernetes for production? Have a read of this blog and accompanying Ansible project for you to run.
The post Cassandra with AxonOps on Kubernetes appeared first on digitalis.io.
]]>Introduction
The following shows how to install AxonOps for monitoring Cassandra. This process specifically requires the official cassandra helm repository.
Using minikube
The deployment should work fine on latest versions of minikube as long as you provide enough memory for it.
minikube start --memory 8192 --cpus=4
minikube addons enable storage-provisioner
⚠️ Make sure you use a recent version of minikube. Also check available drivers and select the most appropriate for your platform
Helmfile
Overview
As this deployment contains multiple applications we recommend you use an automation system such as Ansible or Helmfile to put together the config. The example below uses helmfile.
Install requirements
You would need to install the following components:
Alternatively you can consider using a dockerized version of them both such as https://hub.docker.com/r/chatwork/helmfile
Config files
The values below are set for running on a laptop with minikube, adjust accordingly for larger deployments.
The values below are set for running on a laptop with minikube, adjust accordingly for larger deployments.
helmfile.yaml
---
repositories:
  - name: stable
    url: https://kubernetes-charts.storage.googleapis.com
  - name: incubator
    url: https://kubernetes-charts-incubator.storage.googleapis.com
  - name: axonops-helm
    url: https://repo.axonops.com/public/helm/helm/charts/
  - name: bitnami
    url: https://charts.bitnami.com/bitnami
releases:
  - name: axon-elastic
    namespace: {{ env "NAMESPACE" | default "monitoring" }}
    chart: "bitnami/elasticsearch"
    wait: true
    labels:
      env: minikube
    values:
      - fullnameOverride: axon-elastic
      - imageTag: "7.8.0"
      - data:
          replicas: 1
          persistence:
            size: 1Gi
            enabled: true
            accessModes: [ "ReadWriteOnce" ]
      - curator:
          enabled: true
      - coordinating:
          replicas: 1
      - master:
          replicas: 1
          persistence:
            size: 1Gi
            enabled: true
            accessModes: [ "ReadWriteOnce" ]

  - name: axonops
    namespace: {{ env "NAMESPACE" | default "monitoring" }}
    chart: "axonops-helm/axonops"
    wait: true
    labels:
      env: minikube
    values:
      - values.yaml

  - name: cassandra
    namespace: cassandra
    chart: "incubator/cassandra"
    wait: true
    labels:
      env: dev
    values:
      - values.yaml
values.yaml
---
persistence:
  enabled: true
  size: 1Gi
  accessMode: ReadWriteMany

podSettings:
  terminationGracePeriodSeconds: 300

image:
  tag: 3.11.6
  pullPolicy: IfNotPresent

config:
  cluster_name: minikube
  cluster_size: 3
  seed_size: 2
  num_tokens: 256
  max_heap_size: 512M
  heap_new_size: 512M

env:
  JVM_OPTS: "-javaagent:/var/lib/axonops/axon-cassandra3.11-agent.jar=/etc/axonops/axon-agent.yml"

extraVolumes:
  - name: axonops-agent-config
    configMap:
      name: axonops-agent
  - name: axonops-shared
    emptyDir: {}
  - name: axonops-logs
    emptyDir: {}
  - name: cassandra-logs
    emptyDir: {}

extraVolumeMounts:
  - name: axonops-shared
    mountPath: /var/lib/axonops
    readOnly: false
  - name: axonops-agent-config
    mountPath: /etc/axonops
    readOnly: true
  - name: axonops-logs
    mountPath: /var/log/axonops
  - name: cassandra-logs
    mountPath: /var/log/cassandra

extraContainers:
  - name: axonops-agent
    image: digitalisdocker/axon-agent:latest
    env:
      - name: AXON_AGENT_VERBOSITY
        value: "1"
    volumeMounts:
      - name: axonops-agent-config
        mountPath: /etc/axonops
        readOnly: true
      - name: axonops-shared
        mountPath: /var/lib/axonops
        readOnly: false
      - name: axonops-logs
        mountPath: /var/log/axonops
      - name: cassandra-logs
        mountPath: /var/log/cassandra

axon-server:
  elastic_host: http://axon-elastic-elasticsearch-master
  image:
    repository: digitalisdocker/axon-server
    tag: latest
    pullPolicy: IfNotPresent


axon-dash:
  axonServerUrl: http://axonops-axon-server:8080
  service:
    # use NodePort for minikube, change to ClusterIP or LoadBalancer on fully featured
    # k8s deployments such as AWS or Google
    type: NodePort
  image:
    repository: digitalisdocker/axon-dash
    tag: latest
    pullPolicy: IfNotPresent
axon-agent.yml
axon-server:
    hosts: "axonops-axon-server.monitoring" # Specify axon-server IP axon-server.mycompany.
    port: 1888

axon-agent:
    org: "minikube" # Specify your organisation name
    human_readable_identifier: "axon_agent_ip" # one of the following:

NTP:
    host: "pool.ntp.org" # Specify a NTP to determine a NTP offset

cassandra:
  tier0: # metrics collected every 5 seconds
      metrics:
          jvm_:
            - "java.lang:*"
          cas_:
            - "org.apache.cassandra.metrics:*"
            - "org.apache.cassandra.net:type=FailureDetector"

  tier1:
      frequency: 300 # metrics collected every 300 seconds (5m)
      metrics:
          cas_:
            - "org.apache.cassandra.metrics:name=EstimatedPartitionCount,*"

  blacklist: # You can blacklist metrics based on Regex pattern. Hit the agent on http://agentIP:9916/metricslist to list JMX metrics it is collecting
    - "org.apache.cassandra.metrics:type=ColumnFamily.*" # duplication of table metrics
    - "org.apache.cassandra.metrics:.*scope=Repair#.*" # ignore each repair instance metrics
    - "org.apache.cassandra.metrics:.*name=SnapshotsSize.*" # Collecting SnapshotsSize metrics slows down collection
    - "org.apache.cassandra.metrics:.*Max.*"
    - "org.apache.cassandra.metrics:.*Min.*"
    - ".*999thPercentile|.*50thPercentile|.*FifteenMinuteRate|.*FiveMinuteRate|.*MeanRate|.*Mean|.*OneMinuteRate|.*StdDev"

  JMXOperationsBlacklist:
    - "getThreadInfo"
    - "getDatacenter"
    - "getRack"

  DMLEventsWhitelist: # You can whitelist keyspaces / tables (list of "keyspace" and/or "keyspace.table" to log DML queries. Data is not analysed.
  # - "system_distributed"

  DMLEventsBlacklist: # You can blacklist keyspaces / tables from the DMLEventsWhitelist (list of "keyspace" and/or "keyspace.table" to log DML queries. Data is not analysed.
  # - system_distributed.parent_repair_history

  logSuccessfulRepairs: false # set it to true if you want to log all the successful repair events.

  warningThresholdMillis: 200 # This will warn in logs when a MBean takes longer than the specified value.

  logFormat: "%4$s %1$tY-%1$tm-%1$td %1$tH:%1$tM:%1$tS,%1$tL %5$s%6$s%n"
Start up
Create Axon Agent configuration
kubectl create ns cassandra
kubectl create configmap axonops-agent --from-file=axon-agent.yml -n cassandra
Run helmfile
With locally installed helm and helmfile
cd your/config/directory
hemlfile sync
With docker image
docker run --rm
    -v ~/.kube:/root/.kube
    -v ${PWD}/.helm:/root/.helm
    -v ${PWD}/helmfile.yaml:/helmfile.yaml
    -v ${PWD}/values.yaml:/values.yaml
    --net=host chatwork/helmfile sync
Access
Minikube
If you used minikube, identify the name of the service with kubectl get svc -n monitoring and launch it with
minikube service axonops-axon-dash -n monitoringLoadBalancer
Find the DNS entry for it:
kubectl get svc -n monitoring -o wideOpen your browser and copy and paste the URL.
Troubleshooting
Check the status of the pods:
kubectl get pod -n monitoring
kubectl get pod -n cassandra
Any pod which is not on state Running check it out with
kubectl describe -n NAMESPACE pod POD-NAMEStorage
One common problem is regarding storage. If you have enabled persistent storage you may see an error about persistent volume claims (not found, unclaimed, etc). If you’re using minikube make sure you enable storage with
minikube addons enable storage-provisionerMemory
The second most common problem is not enough memory (OOMKilled). You will see this often if you’re node does not have enough memory to run the containers or if the heap settings for Cassandra are not right. kubectl describe command will be showing Error 127 when this occurs.
In the values.yaml file adjust the heap options to match your hardware:
max_heap_size: 512M
  heap_new_size: 512M
Minikube
Review the way you have started up minikube and assign more memory if you can. Also check the available drivers and select the appropriate for your platform. On MacOS where I tested hyperkit or virtualbox are the best ones.
minikube start --memory 10240 --cpus=4 --driver=hyperkitPutting it all together
Related Articles
K3s – lightweight kubernetes made ready for production – Part 2
Do you want to know securely deploy k3s kubernetes for production? Have a read of this blog and accompanying Ansible project for you to run.
K3s – lightweight kubernetes made ready for production – Part 1
Do you want to know securely deploy k3s kubernetes for production? Have a read of this blog and accompanying Ansible project for you to run.
The post Cassandra with AxonOps on Kubernetes appeared first on digitalis.io.
]]>The post AxonOps Beta Released appeared first on digitalis.io.
]]>
Frustrated by the operational tooling available for Apache Cassandra, Digitalis built their own called AxonOps. AxonOps provides the following assistance for your Cassandra clusters.
It’s been a while since my last blog about AxonOps but we’re excited to announce that AxonOps beta is now available for you to download and install! The installation instructions are available from https://docs.axonops.com
AxonOps is an operational tool for your Apache Cassandra clusters – regardless of where they are deployed – cloud or on-premises. Please read my previous blog to for more detailed motivations and descriptions.
It has the following functionalities;
- Metrics collection and dashboards
- Log and events collection and dashboards
- Flexible service health checks
- Alert notifications with standard tools including PagerDuty, SMTP, Slack, and Generic Webhooks.
- Cassandra data backup and restore scheduler
- Fully automatic Cassandra repair
AxonOps does all of this with a very simple deployment model;
- One agent for logs, metrics, backup operations and repairs
- Single server and GUI service
- Elasticsearch as a data store
We have made this as simple as possible with our APT and YUM repositories and simple steps for installation. See https://docs.axonops.com/installation/axon-server/ubuntu/, https://docs.axonops.com/installation/axon-server/centos/
We are looking for some beta testers as we’d love to hear your feedback on AxonOps. We believe the implementation process is immensely quicker and easier than cobbling together multiple standard tools like Grafana, Prometheus, ELK, Nagios, etc, as AxonOps works out of the box with negligible amount of configurations to get going. All the charts and dashboards are laid out intuitively for managing Cassandra.
Please contact us at [email protected] if you are interested to learn more about the product.

Hayato Shimizu
Co-founder & CEO
Hayato is an experienced technology leader, architect, software engineer, DevOps practitioner, and a real-time distributed data expert. He is passionate about building highly scalable internet facing systems. He came across Apache Cassandra in 2010 and became an advocate for this open-source distributed database technology.
Related Articles
Cassandra with AxonOps on Kubernetes
How to deploy Apache Cassandra on Kubernetes with AxonOps management tool. AxonOps provides the GUI management for the Cassandra cluster.
AxonOps Beta Released
We are excited to announce that AxonOps beta is now available for you to download and install!
AxonOps
AxonOps is a platform we have created which consists of 4 key components – javaagent, native agent, server, and GUI making it extremely simple to deploy in any Linux infrastructure
The post AxonOps Beta Released appeared first on digitalis.io.
]]>The post AxonOps appeared first on digitalis.io.
]]>Digitalis was founded just over 2.5 years ago, to provide expertise in complex distributed data platforms. We provide both consulting services and managed services for Cassandra, Kafka, Spark, Elasticsearch, DataStax Enterprise, Confluent and more.
In the beginning we started using a number of popular open source tools to implement our monitoring and alerting for our managed services, namely Prometheus, Grafana, ELK, Consul, Ansible etc. These are fantastic open source tools and they have served us well, giving us the confidence to manage enterprise deployment of distributed data platforms – alerting us when there are problems, ability to diagnose issues quickly, automatically performing routine scheduled tasks etc.
We found over time that these tools have become the focal point instead of the products we are supposed to be looking after. Each one of these open source tools requires frequent updates, configuration changes etc. imposing a significant amount of management effort to keep on top of it all. The complexity of the tools deployment architecture made the stack slow to deploy for our customers, in particular highly regulated industries such as financial services and healthcare.
We went back to the drawing board with the aim of reducing the efforts needed to on-board new customers and made a wish list.
- On-premises / cloud deployment
- Single dashboard for metrics / logs / service health
- Simple alert rules configurations
- Capture all metrics at high resolution (with Cassandra there are well over 20,000 metrics!)
- Capture logs and internal events like authentication, DDL, DML etc
- Scheduled backup / restore feature
- Performs domain specific administrative tasks, including Cassandra repair
- Manages the following products;
- Apache Cassandra
- Apache Kafka
- DataStax Enterprise
- Confluent Enterprise
- Elasticsearch
- Apache Spark
- etc
- Simplified deployment model
- Single agent for collecting metrics, logs, event, configs
- The same agent performs execution of health checks, backup, restore
- Single socket connection initiated by agent to management server requiring only simple firewall rules
- Bi-directional communication between agent and management server over the single socket
- Modern snappy GUI
- Manages Cassandra, Kafka, Elasticsearch etc etc
What the tool is not:
- Generic software like Grafana and ELK requiring a lot of custom configurations.
- Database – our software is stateless and plugs into external databases. Currently only supports Elasticsearch but we are looking to add others.
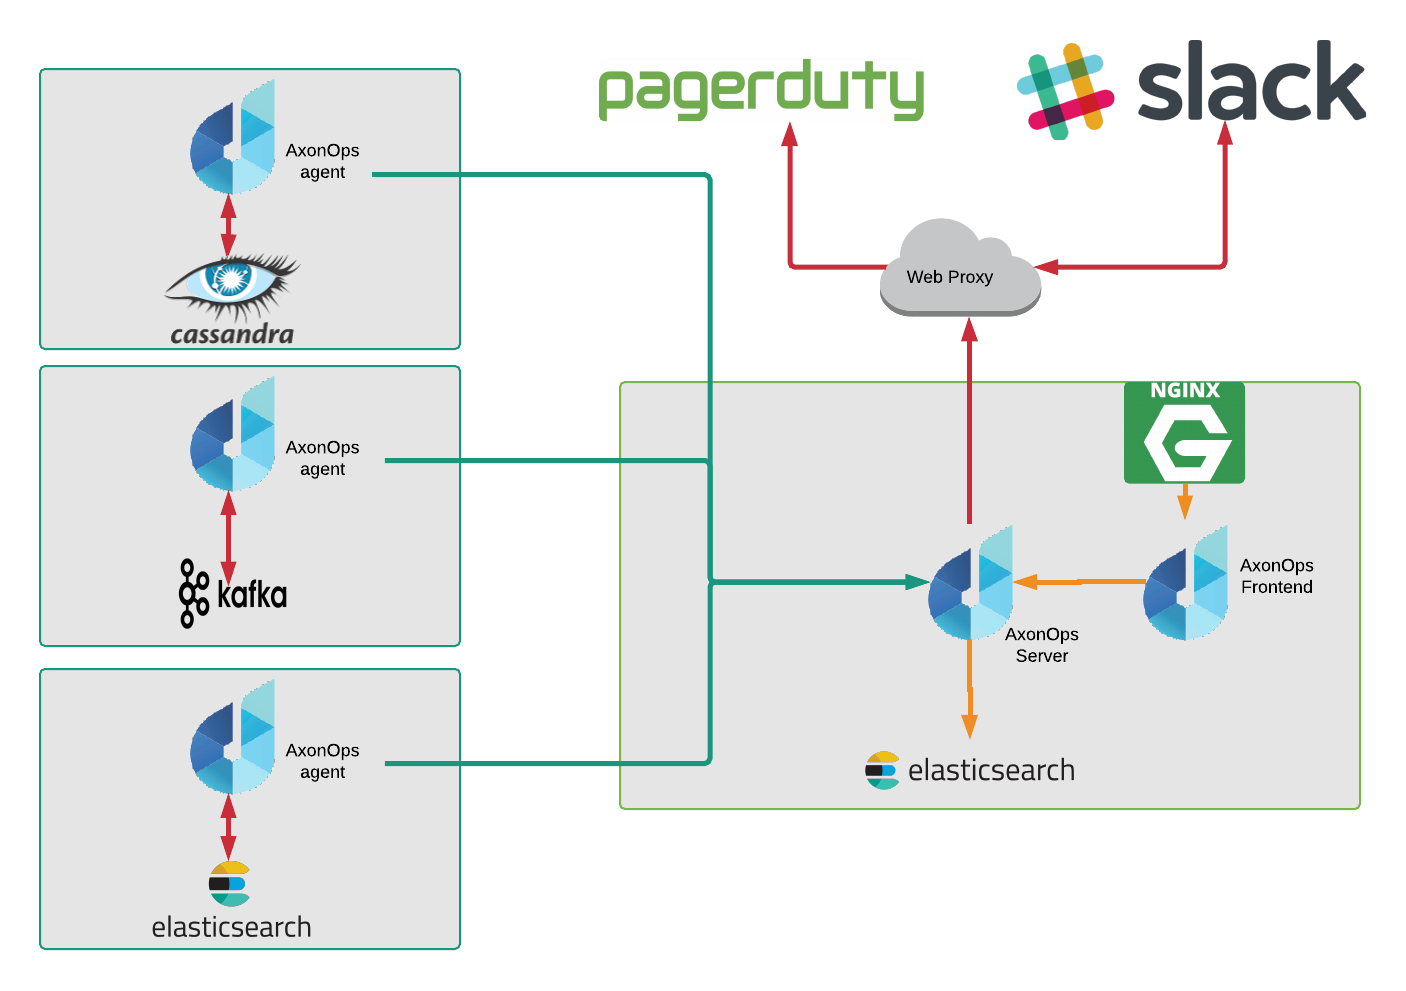
The target deployment architecture needed to be as simple as possible.
Build it
We imagineered, built the tool, and called it AxonOps. It consists of just 4 components – javaagent, native agent, server, and GUI making this extremely simple to deploy in any infrastructure as long as it is Linux!
Agent
We imagineered, built the tool, and called it AxonOps. It consists of just 4 components – javaagent, native agent, server, and GUI making this extremely simple to deploy in any infrastructure as long as it is Linux!
AxonOps agent makes a single socket connection to the server for transporting the following;
- Logs
- Metrics
- Events
- Configurations
Agent-server connectivity works securely over the web infrastructure. To prove it we have successfully tested this working over the internet, load balancers before reaching the backend AxonOps server.
We have put in a mammoth effort in designing the agent as efficient as possible. We carefully defined and crafted a network protocol to keep the bandwidth requirements very low, even when shipping over 20,000 metrics every 5 seconds. This was unthinkable with our previous setup with jmx_exporter and Prometheus which required us to throw away most of the metrics. Now we have all the metrics at hand at a much higher resolution.
We avoided using JMX when connecting to the JVM, as many of you will be aware that scraping a large number of metrics causes CPU spikes. Instead, we built a Java agent that pushes all metrics to the native Linux AxonOps agent running on the same server. The Java agent also captures various internal events including authentication, JMX events (when people execute nodetool commands), DDL, DCL, etc. which are then shipped to the server, monitored and stored in Elasticsearch for queries.
Server
We built our server in Golang. Having spent many years building JVM based applications in the past, we are extremely impressed and pleased with the double digit megabytes memory footprint!
AxonOps server provides the endpoint for agents to connect into, as well as the API for the GUI.
The metrics API we implemented is Prometheus compatible. Our dashboard provides a comprehensive set of charts, but your existing Grafana can also be connected to AxonOps server to integrate with other dashboards.
AxonOps currently persists all its configurations, metrics, logs, and events into Elasticsearch. We need Elasticsearch for the storage of events and logs to make them searchable. For this initial version we decided to use Elasticsearch for all of AxonOps persistence requirements for simplicity. However, we are acutely aware of more efficient time series databases available on the market, and it is on our roadmap to add support for these.
GUI
The GUI is built as a single executable Linux binary file containing all assets, using Node.js and React.js frameworks. We decided to use Material Design look and feel, with an aim to make the GUI snappy and intuitive to use.
Some of the functionalities we have implemented are described below.
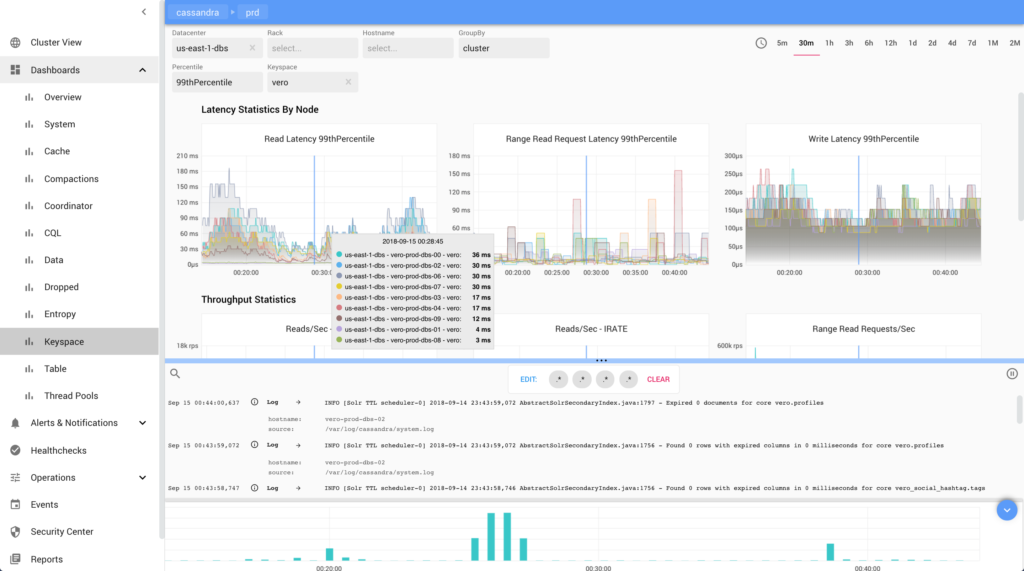
GUI – Dashboard with Metrics and Logs
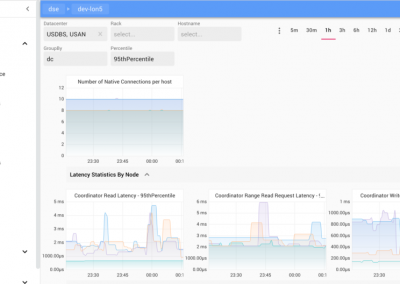
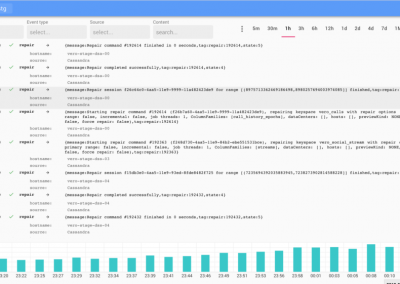
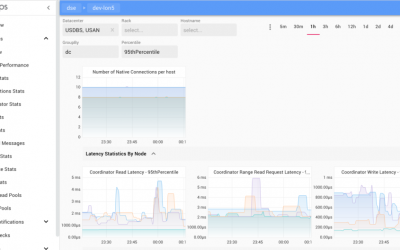
We took inspiration from Grafana and ELK when designing our dashboards, but embedded both charts and logs in a single view with time range governing the display of both features. Alert rules can be defined graphically in each chart to integrate with PagerDuty and Slack for alerts etc.
GUI – Service Healthcheck
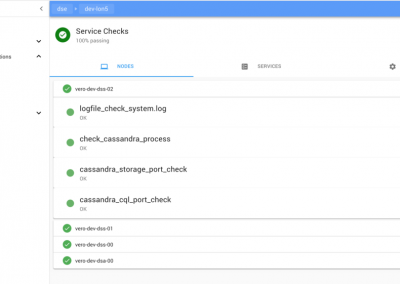
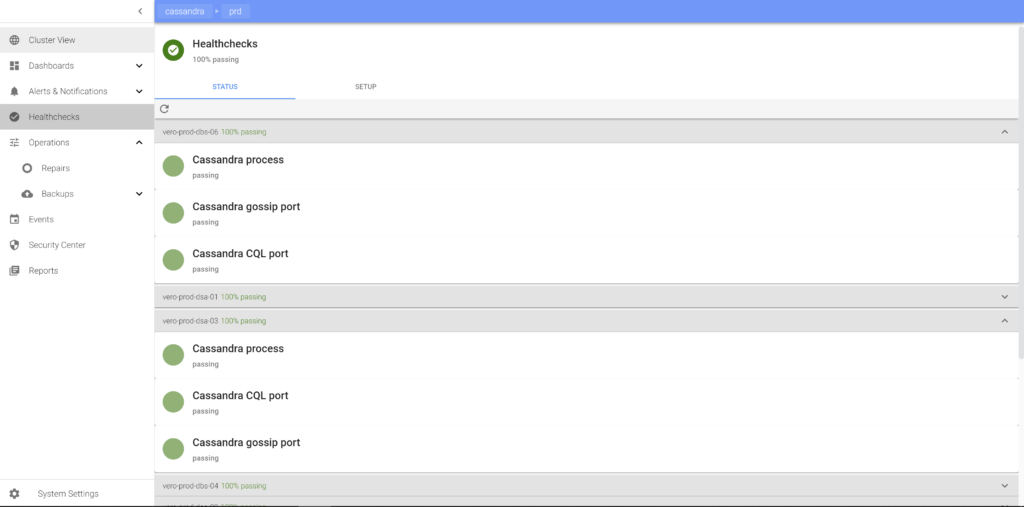
Having a service health dashboard to give us quick RAG status is extremely important to us. Systems like Nagios and Consul provided such functionality prior to building AxonOps. Again we wanted this integrated in the solution.
We have built this in a way that the configurations can be dynamically updated and pushed out to the agents. This means we do not have to deploy any scripts to the individual target servers. There are three types of checks we have implemented which cover all of our use cases;
- shell
- http
- tcp
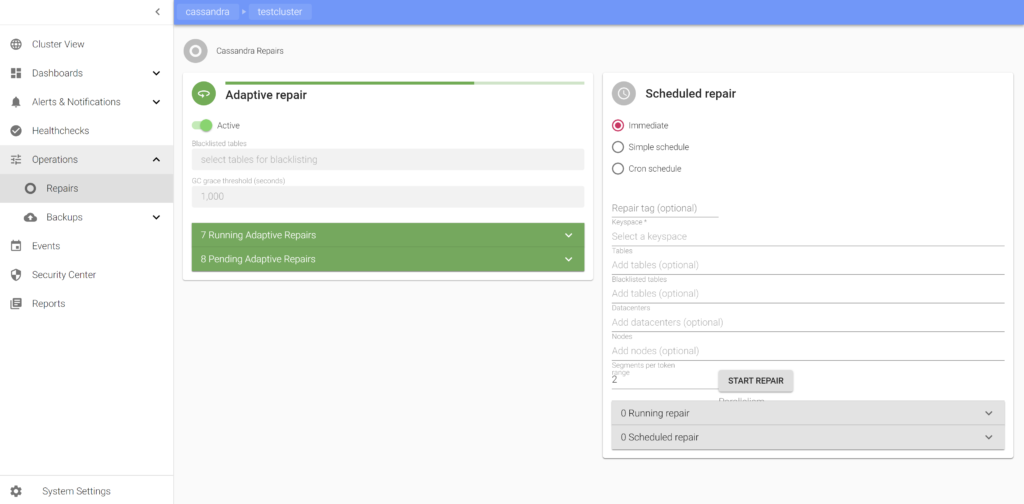
GUI – Adaptive Regulation of Repair
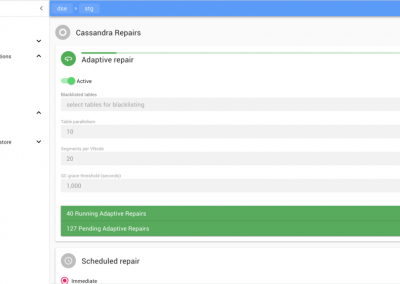
Repair is one of the most difficult aspects of managing Cassandra clusters. There are only few tools available out there, most popular one being Reaper. I was once told by an engineer at Spotify the name was derived from mispronouncing the word “repair” with Swedish accent! Anyway, we did go through the Reaper code to see if this may work for us. Upon analysis we decided to implement our own.
Since AxonOps collects performance metrics and logs, we theorised a slightly more sophisticated approach than Reaper – an “Adaptive” repair system which regulates the velocity (parallelism and pauses between each subrange repair) based on performance trending data. The regulation of repair velocity takes input from various metrics including CPU utilisation, query latencies, Cassandra thread pools pending statistics, and IOwait percentage, while tracking the schedule of repair based on gc_grace_seconds for each table.
The idea of this is to achieve the following:
- Completion of repair within gc_grace_seconds of each table
- Repair process does not affect query performance
In essence, adaptive repair regulator slows down the repair velocity when it deems the load is going to be high based on the gradient of the rate of increase of load, and speeds up to catch up with the repair schedule when the resources are more readily available.
There is another reason why we decided to not go with Reaper. Reaper requires JMX access from the server, which does not fit well with AxonOps single socket connection model. The adaptive repair service running on AxonOps server orchestrates and issues commands to the agents over this existing connection.
From a user’s point of view, there is only a single switch to enable this service. Keep this enabled and AxonOps will take care of the repair of all tables for you. We are also looking into implementing adaptive compaction control using a similar logic to the adaptive repair.
GUI – Backup & Restore
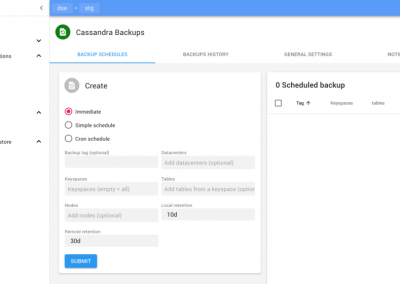
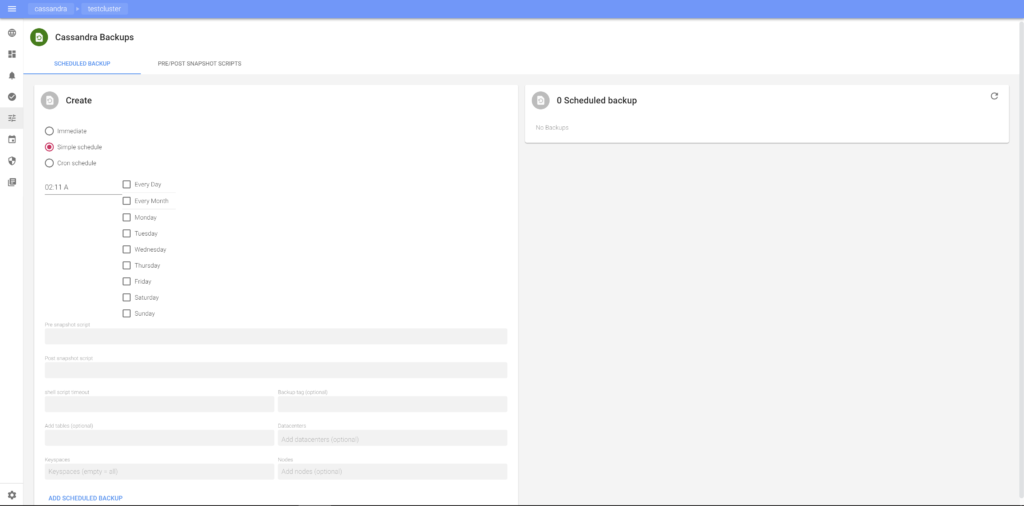
Scheduled backup & restore is another requirement for our customers. We have added this feature in a way that it can flexibly integrate with various backup solutions that our customers use. It schedules Cassandra snapshots, with an option to attach pre/post snapshot script execution for each schedule. These scripts are defined on the AxonOps server-side, pushed down dynamically to the agents at execution time, removing the need to have them deployed on each target server in advance. I should point out here that the scripts are pushed down to the agent using the agent/server connection and it does not require SSH access.
GUI – Notification and Alerting
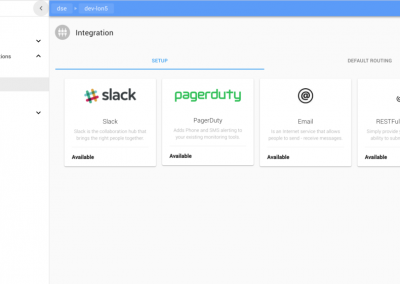
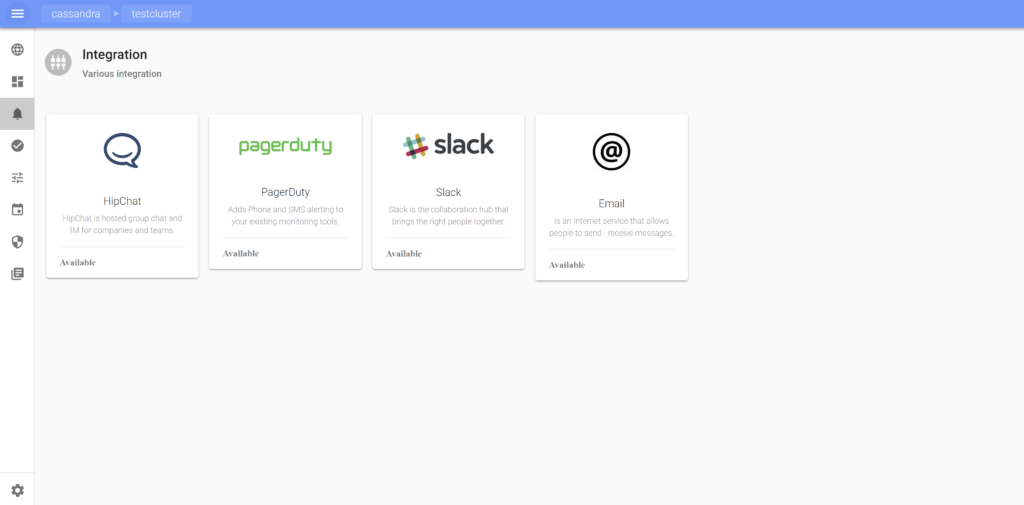
We like to see our operational activities being reported into Slack. We are also heavily reliant on PagerDuty for alerting us on problems for our managed services customers. AxonOps naturally had to have the integrations built into it so event notifications or alerts can be sent to the tools we use!
AxonOps General Availability
We have built AxonOps for ourselves but we are excited about it and we’d like to share this with you. We are shortly going to make AxonOps available for anybody to download and use for free! Please send us an email to [email protected] if you are interested. We’re currently working on the documentation, website, and license but we’ll get in touch when we are ready for you to download.

Hayato Shimizu
Co-founder & CEO
Hayato is an experienced technology leader, architect, software engineer, DevOps practitioner, and a real-time distributed data expert. He is passionate about building highly scalable internet facing systems. He came across Apache Cassandra in 2010 and became an advocate for this open-source distributed database technology.
Related Articles
Cassandra with AxonOps on Kubernetes
How to deploy Apache Cassandra on Kubernetes with AxonOps management tool. AxonOps provides the GUI management for the Cassandra cluster.
An Interesting Behaviour Observed with Cassandra Concurrent Compaction
One of our customers have a short TTL for an IoT use case. The data model is a standard Cassandra time series with a sensor ID as the partition key and timestamp as the clustering column.
There was a requirement by this customer to retrieve some data that was already purged due to TTL.
AxonOps Beta Released
We are excited to announce that AxonOps beta is now available for you to download and install!
The post AxonOps appeared first on digitalis.io.
]]>The post Distributed Data Summit 2018 appeared first on digitalis.io.
]]>We are supporting and sponsoring the Distributed Data Summit for Apache Cassandra this year.
If you are attending this summit do come and chat to us!
Related Articles
Cassandra with AxonOps on Kubernetes
How to deploy Apache Cassandra on Kubernetes with AxonOps management tool. AxonOps provides the GUI management for the Cassandra cluster.
AxonOps Beta Released
We are excited to announce that AxonOps beta is now available for you to download and install!
AxonOps
AxonOps is a platform we have created which consists of 4 key components – javaagent, native agent, server, and GUI making it extremely simple to deploy in any Linux infrastructure
The post Distributed Data Summit 2018 appeared first on digitalis.io.
]]>