.png)
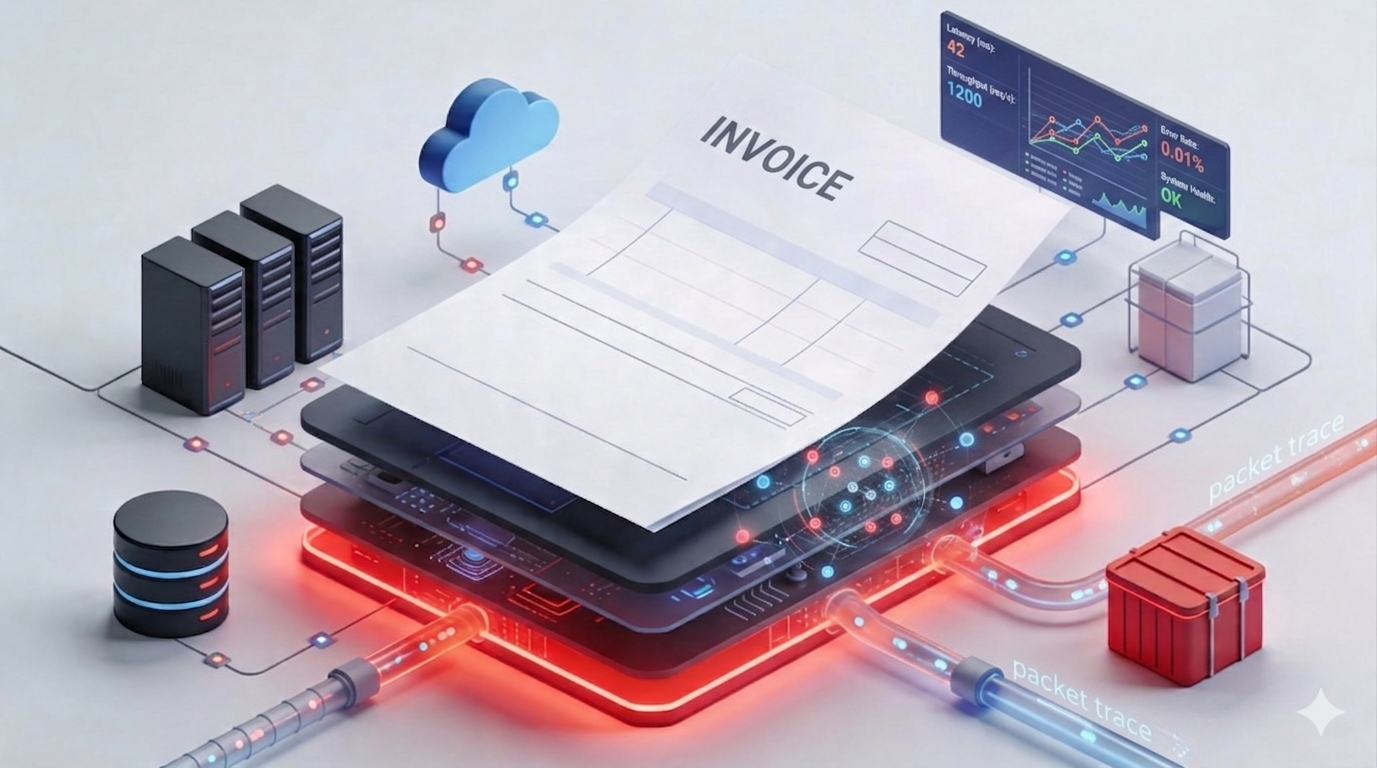
Introduction
At some point, commercial log ingesters (ie, DataDog, NewRelic, dash0, etc) stop feeling like a monitoring tool and starts feeling like a line item you have to explain every month. It is brilliant at getting you from zero to visibility quickly, but once your platform grows, your observability bill tends to grow with it, often faster than you expect. And one you add multiple development, staging and production environments that pricing pressure becomes very real very quickly.
Beyond Datadog: How to Create a Scalable, Cost-Effective Monitoring Solution | Digitalis Blog
That is why we think more teams should seriously consider running their own monitoring stack on Kubernetes. For the kinds of platform teams we work with, it is usually cheaper, far more private, and much easier to manage than people assume, especially when the whole thing is deployed as code.
Why the bill becomes the problem
The issue is not that they are bad. The issue is that, for example, Datadog pricing is tied to the exact things modern platforms do more of over time: more hosts, more containers, more traces, more metrics, and more logs. Datadog’s own pricing page lists Infrastructure Pro at $15 per host per month, APM at $31 per host per month, APM Enterprise at $40 per host per month, and log ingestion starting at $0.10 per GB, before you even get into indexing, flex storage, or extra custom metric costs.
That model can work perfectly well for smaller setups or teams that want everything managed for them. But for larger Kubernetes estates, observability stops being a small operating expense and starts behaving like a tax on scale. The more successful your platform becomes, the more likely it is that your monitoring platform starts punishing you for collecting the very signals you need.
Why self-hosting changes the economics
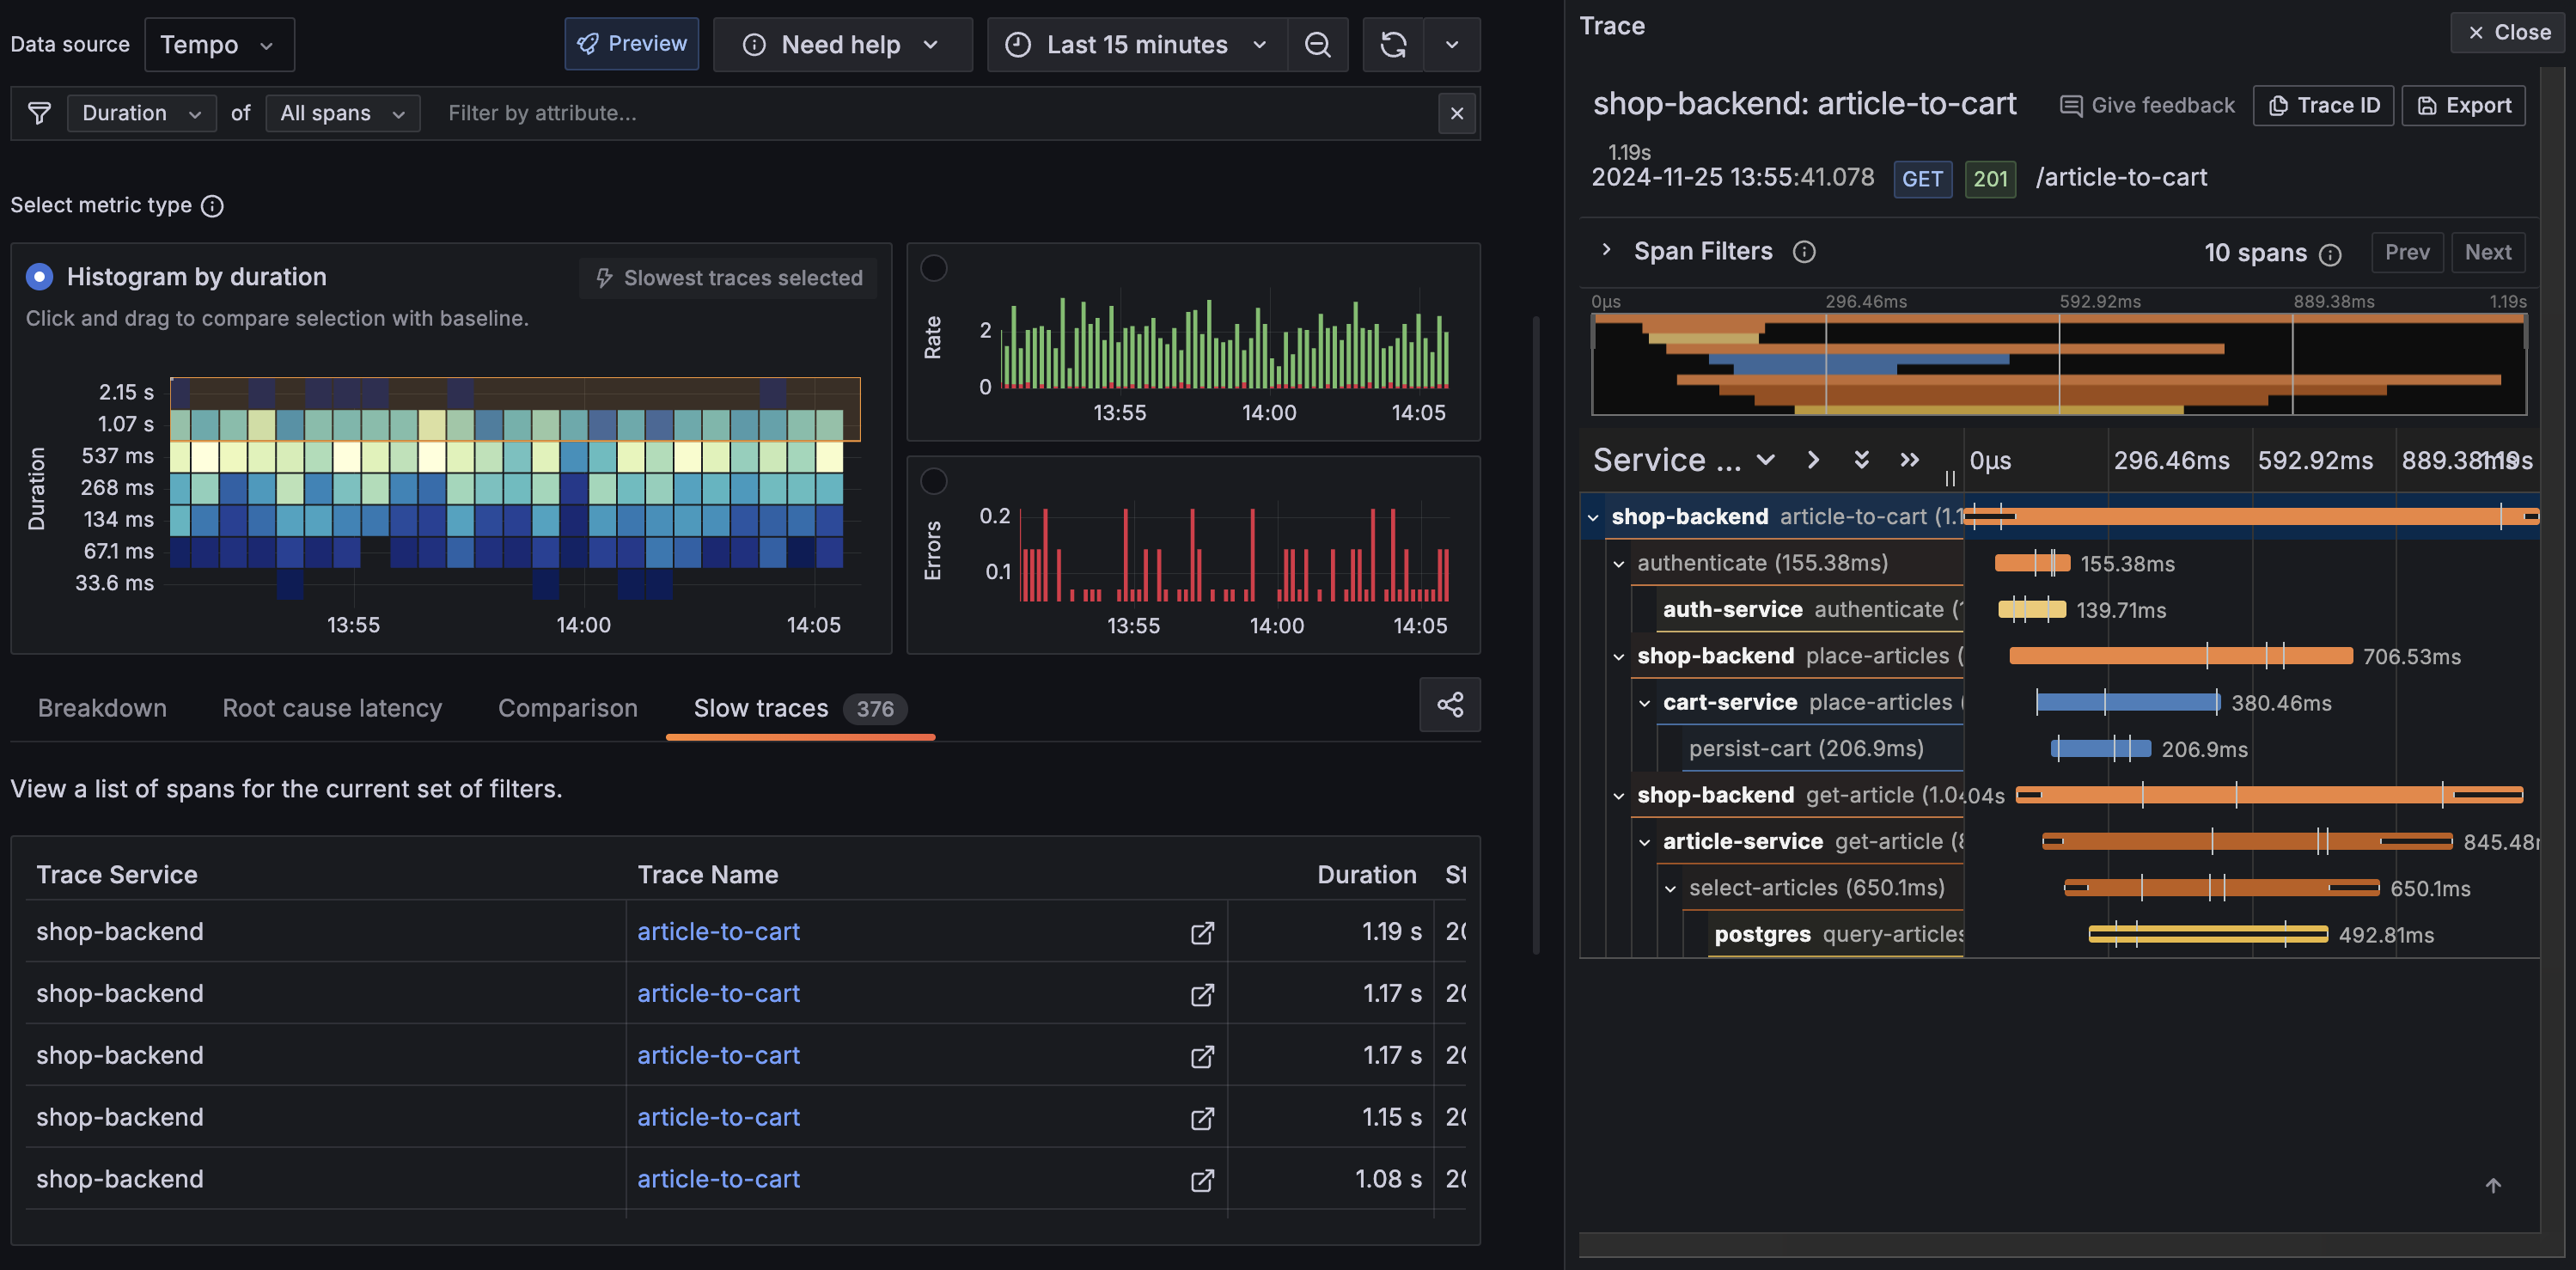
This is where a local Kubernetes-based stack starts to make a lot of sense. When you run your own monitoring, your cost model shifts away from per-host SaaS charging and toward infrastructure you control, mainly compute, memory, and object storage. That matters because object storage is one of the cheapest building blocks in modern infrastructure, and projects like Grafana Tempo and Grafana Mimir explicitly lean on it to keep tracing affordable at scale.
Tempo’s design is a good example of the broader pattern. Grafana describes Tempo as a high-scale tracing backend that is cost-efficient because it requires only object storage to operate, and it specifically avoids the expensive indexing model that makes many tracing backends costly to run at volume. In plain terms, that means you can keep far more telemetry for far less money, as long as you are happy to operate the stack yourself.
Privacy is not a side benefit
The other big advantage is privacy. Monitoring data is not just harmless machine output. It usually includes service names, internal URLs, deployment details, request paths, and, in plenty of cases, logs with more information in them than anyone realised at the time.
For some teams that is fine. For others, especially in regulated environments, it is a real concern. Data residency, internal policy, and customer requirements all come into play very quickly once that telemetry is leaving your own infrastructure.
Running the stack yourself keeps that under your control. You decide where the data lives, how long it stays there, who can access it, and what happens to it over time. And if you build it properly, with encryption in transit and at rest, you are not giving up security to get that control back.
Kubernetes makes this practical
Ten years ago, “build your own monitoring platform” would have sounded like a difficult task. Now, if you are already running Kubernetes, it is mostly just another platform workload. You already have the patterns for deploying services, managing storage, exposing dashboards, handling secrets, and automating lifecycle changes, so observability becomes an extension of the same operating model rather than a separate discipline.
That is why the Digitalis Terraform example is so useful. It shows that this is not about inventing a bespoke stack from scratch; it is about codifying a repeatable deployment model and letting Kubernetes do what Kubernetes already does well. For platform teams already using Terraform, that feels much more natural than clicking around a SaaS UI and reverse-engineering configuration drift later.
%20(1).png)
I also think it is worth saying that the operator story in Kubernetes is just genuinely good now. Charts like kube-prometheus-stack have taken a lot of the pain out of self-hosted monitoring because they package the hard parts into something you can deploy quickly, while still giving you room to customise when you need to. And once you start using resources like ServiceMonitor and PodMonitor, the whole thing falls into place. Monitoring stops feeling like a separate system off to the side and starts feeling like a natural part of how you manage workloads in Kubernetes.
Being able to manage the whole infrastructure including dashboards and alerts makes things a lot easier.
A reference cost view
Doing a like-for-like cost comparison is genuinely challenging because each deployment model is costed in a completely different way. Ingesting 1,000 GB per month might feel like a lot, but it is actually quite common. Many companies handle far more than this, especially if they are taking full advantage of OpenTelemetry across their development and production environments.
That is roughly a 75x difference in monthly cost for the same volume of data — and the self-hosted figure includes room to scale retention further without the per-GB indexing penalty Datadog applies.
The figures above exclude Kubernetes costs. The additional overhead is basically zero if you already have a cluster with spare capacity. Your new monitoring stack is just a handful of pods sitting right alongside your existing workloads. You will obviously need to factor in those compute costs if you are starting from scratch or your volume of logs is very large.
If you look at other providers like for example Splunk, you’ll get similar scary figures:
If you do not have Kubernetes already, the monitoring stack is a fantastic excuse to finally make the leap if you are considering Kubernetes for the very first time. You get a solid platform foundation and a highly affordable observability layer all at once.
SIEM
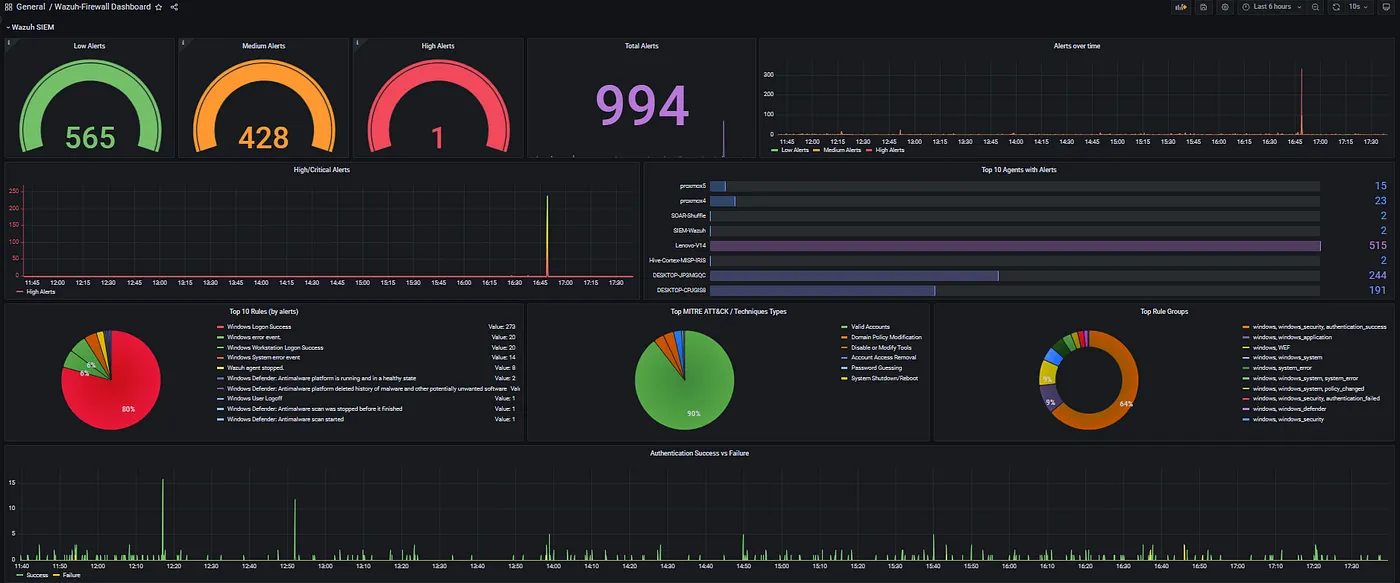
I have focused primarily on logs, traces, and metrics. Another important aspect is Security Information and Event Management (SIEM). We serve many clients in the financial sector where SIEM is essential. Although the Grafana & Prometheus family does not provide SIEM, our go to tool is Wazuh
If you want everything consolidated, you can integrate all sources into Grafana via data sources.
Conclusion
I'm not here to tell you Datadog, New Relic, Dash0, or any of the other SaaS solutions out there are bad. But look, the numbers don't lie. At 1,000 GB a month the difference is already stark, and most production environments are well beyond that. Add data residency into the mix and the case for self-hosting becomes even harder to argue with. You keep your telemetry on your own infrastructure, you pay for storage you control, and you operate it the same way you operate everything else. That feels like the right answer to me.
I for one welcome our new robot overlords