Introduction
Digitalis is managed services company. We set up and manage a wide range of applications and services, in the cloud and on-premises. And we are pretty good at it. We would not have survived as a company otherwise.
As an example, for the last two weeks I’ve been on-call, I did not receive a single call out. And that extends to our sister company AxonOps which provides the best monitoring platform for Apache Cassandra you will find on the market.
But yes, I still think monitoring is hard, painful, tedious and time-consuming.
Why?
Because even the smallest deployment, if you want to monitor it properly, snowballs very quickly. Let’s say all you have is a simple web application. You need to monitor as a minimum:
- The web server
- The Operating System it runs in: Disk, CPU, Memory, Security patches
- Network traffic
- Logs
Now, take the above and put it into Kubernetes:
- Kubernetes control plane
- Kubernetes nodes
- Deployments, Pods, ConfigMaps, Secrets, etc
As you now are in Kube, you would like to take advantage of some of its great features such as autoscaling:
- Horizontal Pod Autoscaler (HPA)
- Vertical Pod Autoscaler (VPA)
- Keda
- Karpenter/Cluster-Autoscaler
This is not the end yet. Because the developers would like to see telemetry events for the web application so that they can debug it:
- OpenTelemetry
- Jaeger
- SPM
Finally, who monitors the monitoring platform? You will also need some meta-monitoring in place.
Measured by time to market, the monitoring stack can easily take you 4 times longer to bring up than the simple web application you were hoping to release.
Hybrid environments with Kubernetes and virtual machines are in my opinion the most complex and harder to monitor.
What can we do?
Aside from curling into a ball and crying yourself to sleep? You can obviously ask Digitalis to help or sign up for AxonOps.

There is no magic bullet here I’m afraid. The best mitigation is automation and code reuse. We have a large repository of configurations for AxonOps, Prometheus, Grafana, etc we use in our managed services.
Core
Prometheus and Grafana are at the core of the monitoring stack. We use them both extensively. Prometheus is greatly extended with the myriad of exporters you can add on. The node exporter is probably the most important for us that’s always installed.
We have used also in the past Consul for monitoring but we slowly phasing it out in favour of Prometheus exporters.
All in-house developed applications export Prometheus metrics we use for monitoring and alerting. The Prometheus library is excellent and very easy to use. Just ask Chat GPT for help 😃
Export Prometheus Metrics in Go
A conversational AI system that listens, learns, and challenges
Logging is very important for us. Our customers in the financial sector have strict requirements on what we need to log and for how long to keep them. Traditionally we have used ElasticSearch and OpenSearch for this. Most recently, we have started using Grafana Loki for all new Kubernetes projects.
Automation
Your first port of call should be automation. We use Ansible when we deploy in Virtual Machines and Terraform plus ArgoCD and Helm Charts when targeting Kubernetes. We just try to reuse most of the code and customise it per customer.
The Prometheus stack is large and complex. It has lots of moving parts and no setup is identical. There are very good resources you can use:
Ansible: https://galaxy.ansible.com/prometheus/prometheus
Kubernetes: https://github.com/prometheus-community/helm-charts/tree/main/charts/kube-prometheus-stack
Either of these will give you a pretty good starting point over which you can build on.
I would not advise anyone to attempt to set up the monitoring stack without automation. There just is a lot to do.
From here, it’s mostly a matter of using the right exporters to ensure you have all you need to alert on. These are some of my favourites:
Node Exporter
ElasticSearch Exporter
Postgres Exporter — if you prefer to run Postgres in Kubernetes, have a look at CloudNative-PG which comes with all pre-set.
Kafka Exporter
JMX Exporter
Alerting
When setting up a monitoring platform, you need to keep in mind two different yet complementary goals: reporting and alerting.
Reporting is very important to spot trends such as applications using too much memory or changes in behaviour for example after an upgrade or application version change.

Alerting on the other hand is reactive. Something has broken and you need to quickly fix it.
You can mix them both and alert on, for instance, trend changes but I seldom do. There is such a thing as too many alerts.

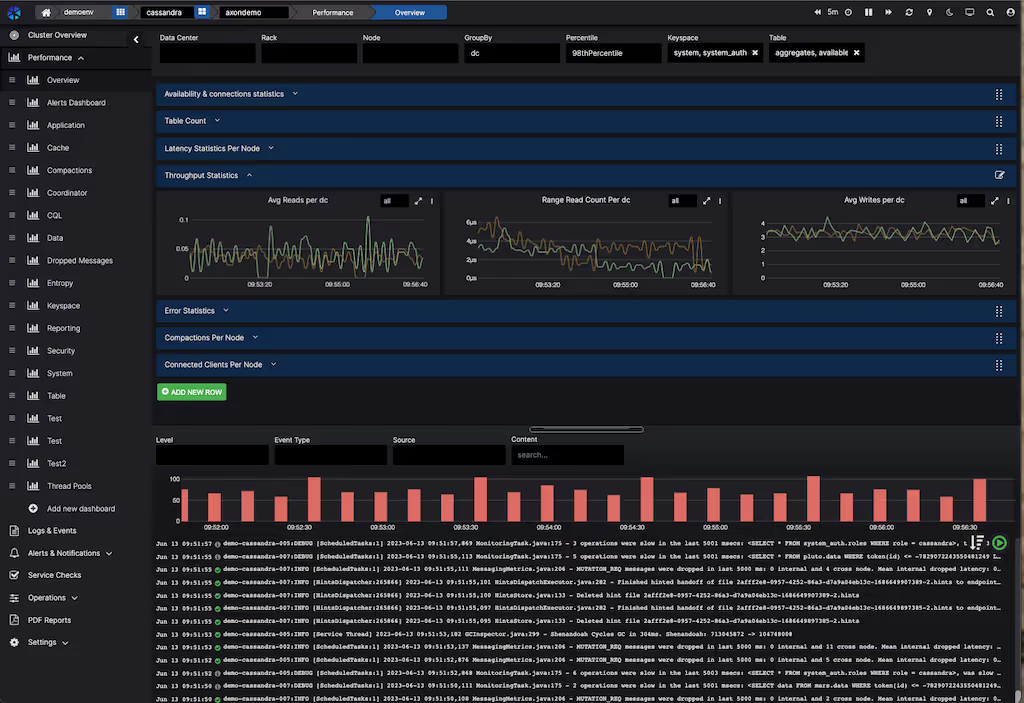
On a few occasions, especially when monitoring Apache Cassandra with AxonOps, we also set up log-based alerts. A good example of this is that we want to know if there has been an attempt to access the Cassandra cluster that has not been authorised.
Conclusion
I would have loved to make this a cheerful and helpful blog but I would have to ignore reality. Monitoring is difficult and there are not many shortcuts to take.
My top two tips for you are: automation, automation, automation and don’t overdo it, too many alerts are as bad as too few.

.png)